BDB Business Story: A Distinguished Big Data Visual Exploration Tool
As Gartner states- "Self-service business intelligence is defined here as end users designing and deploying their own reports and analyses within an approved and supported architecture and tools portfolio."
BDB Business Story liberates the analysts from the complex data modeling and processing to focus on the core aspects of an interactive data visualization tool- data analysis and customization to extract its relevant value. The BDB Business story denotes a self-service model of BI that mesmerizes the front-line decision makers by offering a rare fusion of elementary data visualization with narrative techniques providing actionable insights. It targets the business users as its operator and therefore provides a smooth yet efficient workflow on any size or types of data.
We aim at defining a new meaning of BI Story as data storytelling to go beyond reporting and dashboarding by entering the world of conversational analytics.
Big Data Investigation
The big data era is not just confined to the vast amount of heterogeneous data, it also brings in highly-diverse formats, increased complexity in distributed and stored information. It is a real challenge to process or even save part of this ever streaming data fluctuation. The contemporary set-up requires innovative architecture, improved computation methods, advanced algorithmic approaches to handle the flux created by Big Data.
BDB Business Story makes the data exploration rapid, secure, and exciting. The data analyst can take up data in parts using any attribute and value to explore data and see results via the dynamic search-based index.
Visual Data Analysis
The existing data discovery systems can process a limited amount of data, while the scope of data accumulation in modern business is limitless. The data analysts require a robust method to investigate massive volumes of data and instantly display the outcomes to take quick business decisions.
BDB Business Story consents the business analysts to explore vast amounts of data via a variety of visuals. Users can create interactive views, drill deep into the data segments, add or adjust attributes or aggregations – with lightning speed to respond on millions and billions of rows.
Rapid Discovery of Result
Conventional technologies offer some data exploration models that require more time in processing data if the data size is massive. So, the analysts must wait to see the outcome of their analyzed data.
Business Story interactively explores billions of records and instantly displays result through engaging visuals. BDB’s unique architecture enhances data stores functionality on which a data analyst can perform his investigations. They do not have to wait for batch processes anymore.
Large Range Data Drilling
Datasets inside a data lake can be vast. There are three dimensions to measure this vastness:
- Large - billions of rows
- Wide - hundreds of attributes and metrics
-
Deep - large numbers of values for each attribute
BDB Business Story can analyze billions of rows and hundreds of attributes within seconds. It can endlessly scale out the number of coordinated threads. The data analyst can drill into any granular level of detail to find the exact set of data needed for the analysis.
Integrated Platform
A successful and interactive data exploration at Big Data scale demands an integrated platform to eradicate inefficiencies in resources, process, and data flow.
Business Story, when integrated with the BDB Decision Platform, provides an excellent mechanism for comprehensive Big Data Pipeline, Data Preparation, Advanced Analytics, and Visual Data Exploration.
- Manages data progress from data ingestion or consumption to streamline the conception and distribution of data assets; Eliminates the duplication of data and wasted resources to optimize data retention policies.
- Possesses a single governance and security model that simplifies the process of securing the data while promoting collaboration and sharing.
- Eliminates the duplication of data and wasted resources to optimize data retention policies
- Delivers a unique execution through an operational model that optimizes the delivery of information through data pipelines.
The combination of visual data explorer, the easy spreadsheet-style instruction pattern and enterprise-grade proficiencies of BDB Decision Platform offers a single platform that can transform your raw, complex data into decision-ready data assets for your entire organization.
Case Study -
Problem Statement -
Hiring is a process where you cannot afford to make mistakes. It requires right decisions to be taken at the right time while hiring employees. Another problem is streamlining the hiring process along with improving the quality that demands an excellent team to handle the entire process.
Insightful decision making is based on data and analytics. in any part of a business, structure puts data and analytics to use. Recruitment Analytics can be of rescue in this case while streamlining the hiring process along with improving its quality.
Solution -
In any part of the business, while making decisions, it is advisable to use data-based analytics. In this case, Recruitment Analytics can be of rescue to for tracking, measuring, collating, and analyzing candidate and employee data to make well-informed hiring decisions.
The hiring manager can analyze the process and prepare visual data reports for the Management Executives.
BDB Business Story facilitates the hiring manager to explore data available in various data sources like Excel files, Google Spreadsheets, Survey, RDBMS.
In this case study, we shall showcase how with few steps the hiring manager can start exploring recruitment data and get useful insights-
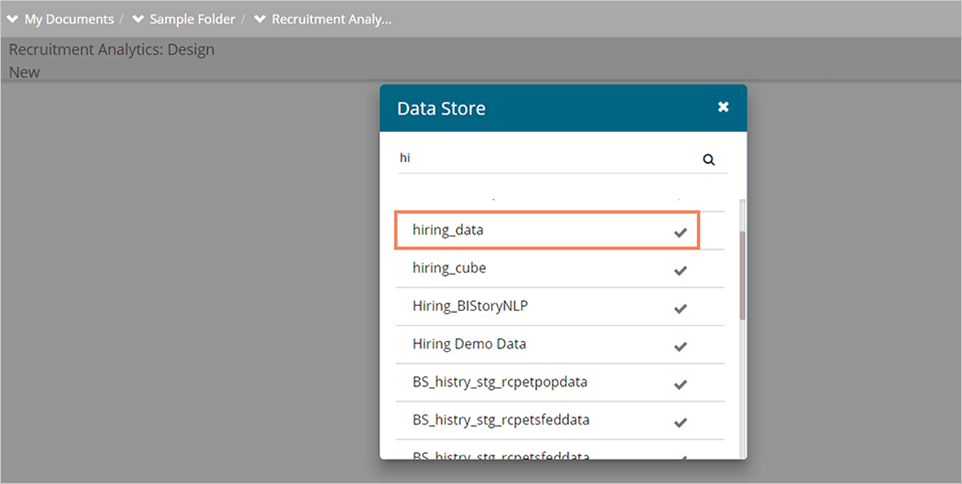
Step 1 - Once the IT team provides the appropriate data store with hiring data, the hiring manager can start creating a visual report. Fist of all the hiring manager requires to select a Data Store from the list.
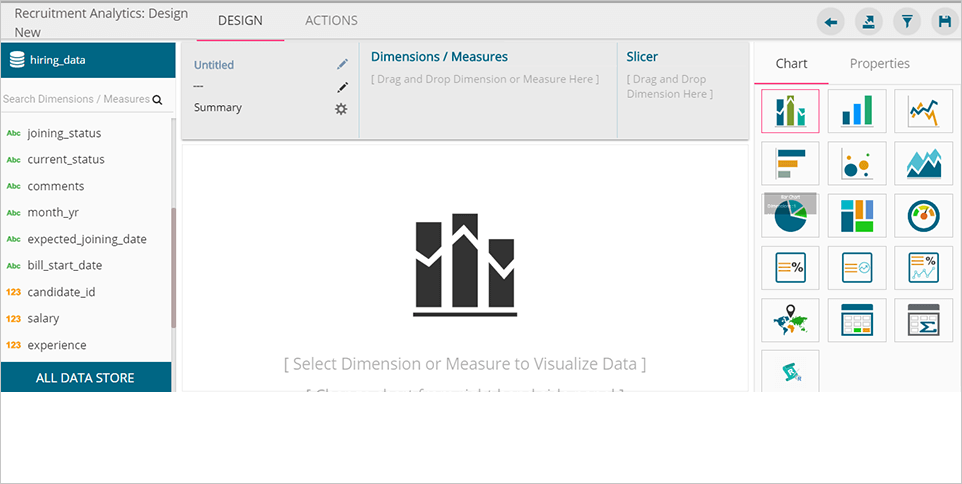
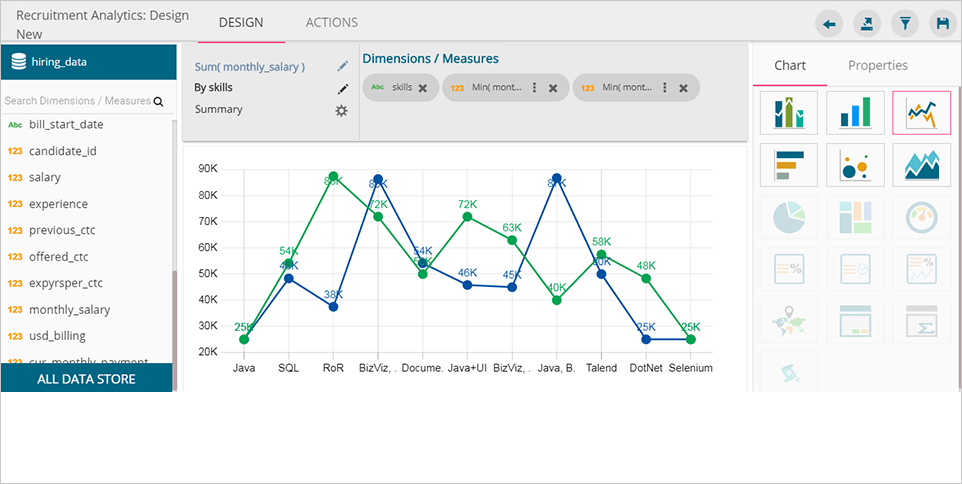
Step 2 –After selecting a data store, the hiring manager will be redirected to design a new view for the recruitment analytics. The page will display all the dimensions and measures on the left panel, the canvas in the middle, and charting properties on the right-side panel. As shown in the following image:
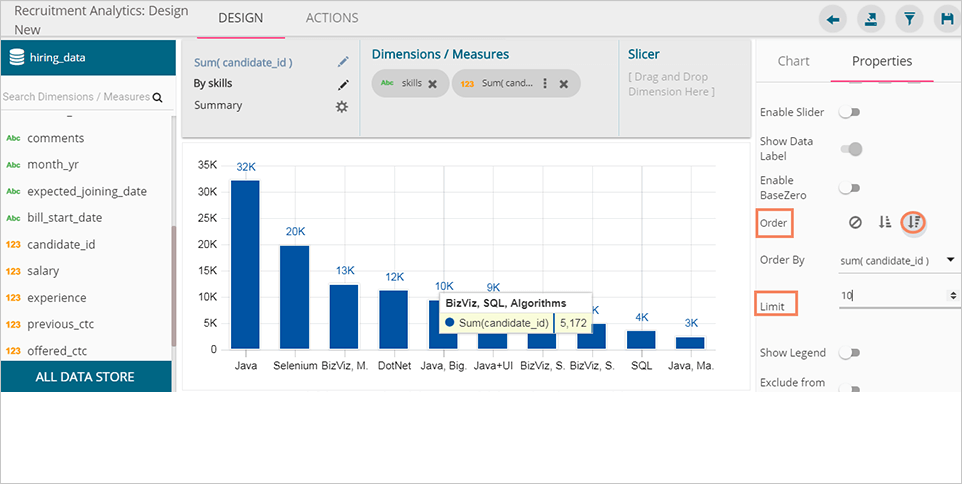
Step 3 -If the Hiring Manager wants to analyze Top 10 Skills company is looking for, then BDB Business Story can be of instant help. Just drag the ‘Skills’ dimension and count it by ‘Candidate_id’ to view all skills. After getting all the required skills sort out the Top 10 skills by applying the ‘Limit’ option. The skills can be shown in ascending or descending order by selecting the 'Order' icon.
Step 4 -The Hiring Manager can instantly view skills-based comparison of monthly salaries for male and female. For this, drag ‘Skills’ and ‘monthly salary’ from the available list of dimensions and measures. Drag ‘monthly salary’ measure twice with an applied filter value once for Male and then for Female. Select the line chart to display the comparison and save it.
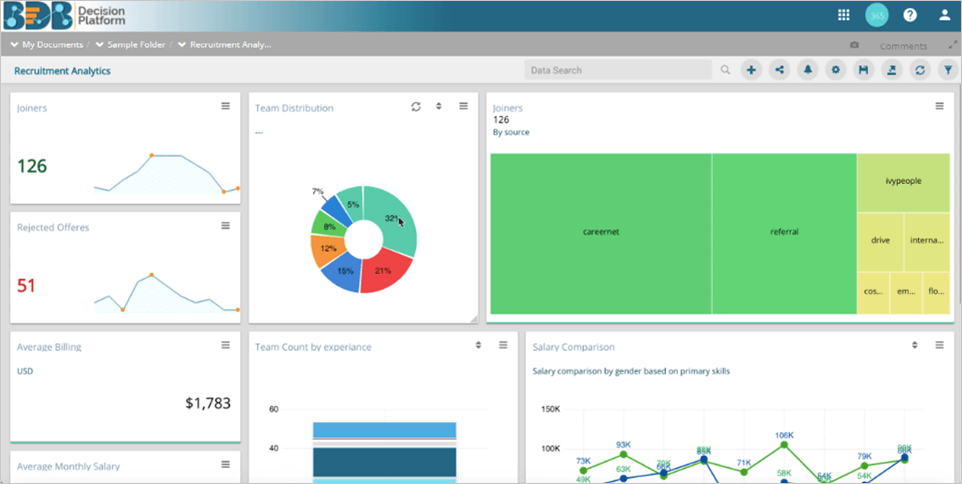
Similarly, the hiring manager can create and add multiple views based on business requirement. E.g. Team Distribution based on designations as shown in the below image:
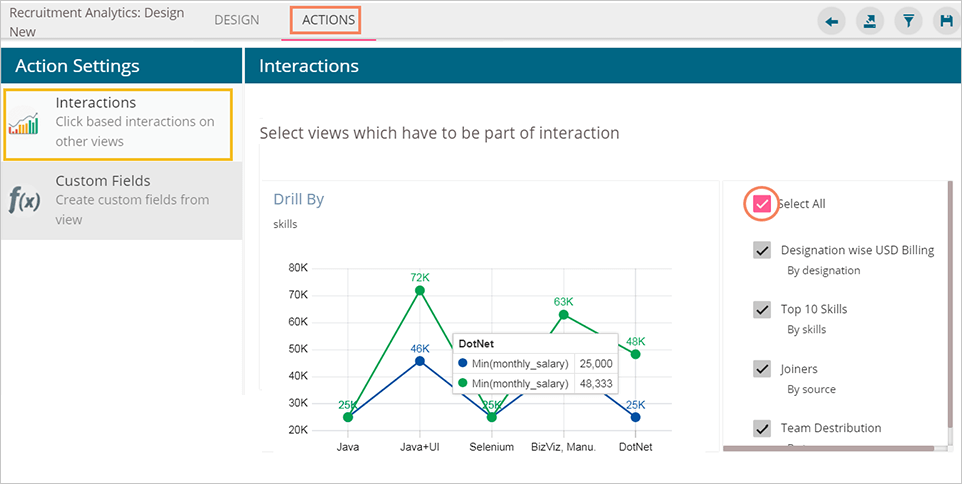
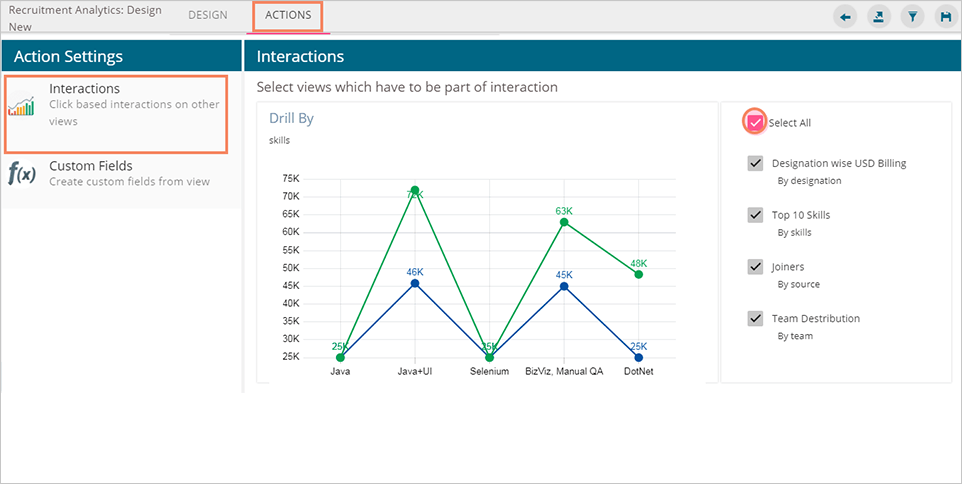
The advanced functinalities of BDB Business Story even allows the Hiring manager to interact with the various views of a story based on the selected value. For this to achieve the hiring manager needs to specify interactions between the views using the ‘ACTIONS’ tab.
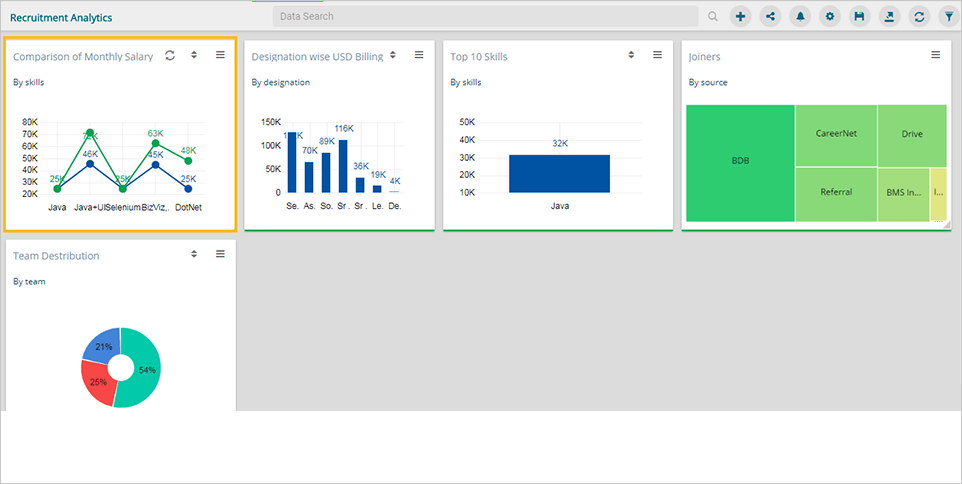
After saving this effect, user can select any one field from the edited view to see interactions in the dependent views of the same story. The below image displays how based on the first view wherein ‘JAVA’ is selected as a skill, the remaining views are modified displaying data for only JAVA skill.
The entire process of creating a business story out of the selected data is easy, quick, and interesting. Business Users can choose a data source, drag and drop the required values (Dimensions/Measures), and get promptly generated views based on the selected data values.
Conclusion -
Using a modern, flexible, and enterprise-ready analytics platform like BDB Decision Platform in your organization, you can move all your analytic processing to one or more servers that can run complicated processes and workflows more quickly and efficiently, enabling you to take advantage of key business opportunities and maintain your competitive advantage. With higher processing power, collaboration, and speed, your data analysts can get the profound insights they need to help your organization.
Experience industry's first interactive visual data exploration platform to explore your business data at lightning speed. Let your data analysts access the data lake and examine all aspects of your relevant business data to resolve complex analytics problems by deriving exceptional value from the data.
For more details, please contact us sales@bdb.ai