BizViz makes Excel better with Data Story Telling using the visualization.
BizViz 2.0 is all set to launch its ground breaking feature 'Business Story'.
This line may arise many questions into your mind, if you are actually reading it. Some of them can be.
Why 'Story'? Can there be a 'Business Story'? How can storytelling be a ground breaking feature for a software?
Well, in order to get your answers, you need to read the below given story.
Why 'Story'?
- It is the most used form within and across cultures
- It is the most interesting form to pass on information or knowledge
- It has an inbuilt ability to structure any given content
- It is an interactive form to involve the target audience
Can there be a 'Business Story'?
Yes, in fact a business data that is communicated using story telling medium becomes easy to understand, interesting, and memorable.
A typical board room presentation becomes so obsessed with data and fact that at times, the core message is missed by the target audience. BizViz Business Story is a powerful means to overcome this flow.
Some beneficial features of 'Business Story':
- Structures desperate collection of data
- Emphasizes important information
- Safeguards authenticity of information
- Uses advanced visuals and charts
- Overall interesting, yet fact based experience for target audience
We being a BI expert understand it well that everyone who analyzes data has something to tell about, so join us to make your BI stories meaningful and memorable, acute and interesting, easy and insightful at once.
Start creating your BI Story & get actionable insight.
Follow the below mentioned process to create Business Story using BizViz.
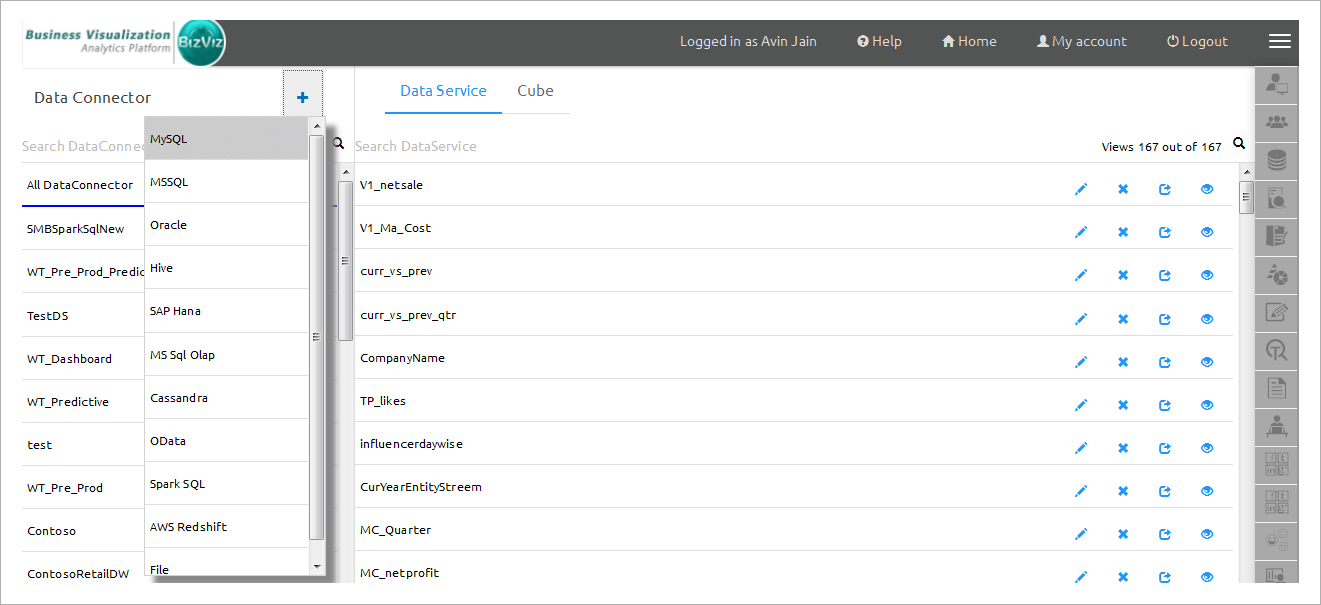
- To create a story login to the BizViz analytical portal which is a cloud based solution.
- As BizViz supports connectivity to industry standard databases users can connect to the wide range of data sources available.
Users can create an in-memory cube.
- Getting Data:Information related to the cube needs to be provided
- Hierarchy Definition:Users can define a drill path here. Where the drill action can be viewed in the report.
- Data Restrictions: User level report viewing restrictions can be defined here.
- Schedule:User can schedule the cube as per the business requirement.
- You have successfully created the cube. Now we have to create Business Story. For this come back to the homepage 'Right-Click' and select 'Create Story' option.
- Now the user will be prompted to enter the Story details like story name, description etc. Click on the story and select the required cube with which you want to connect to.
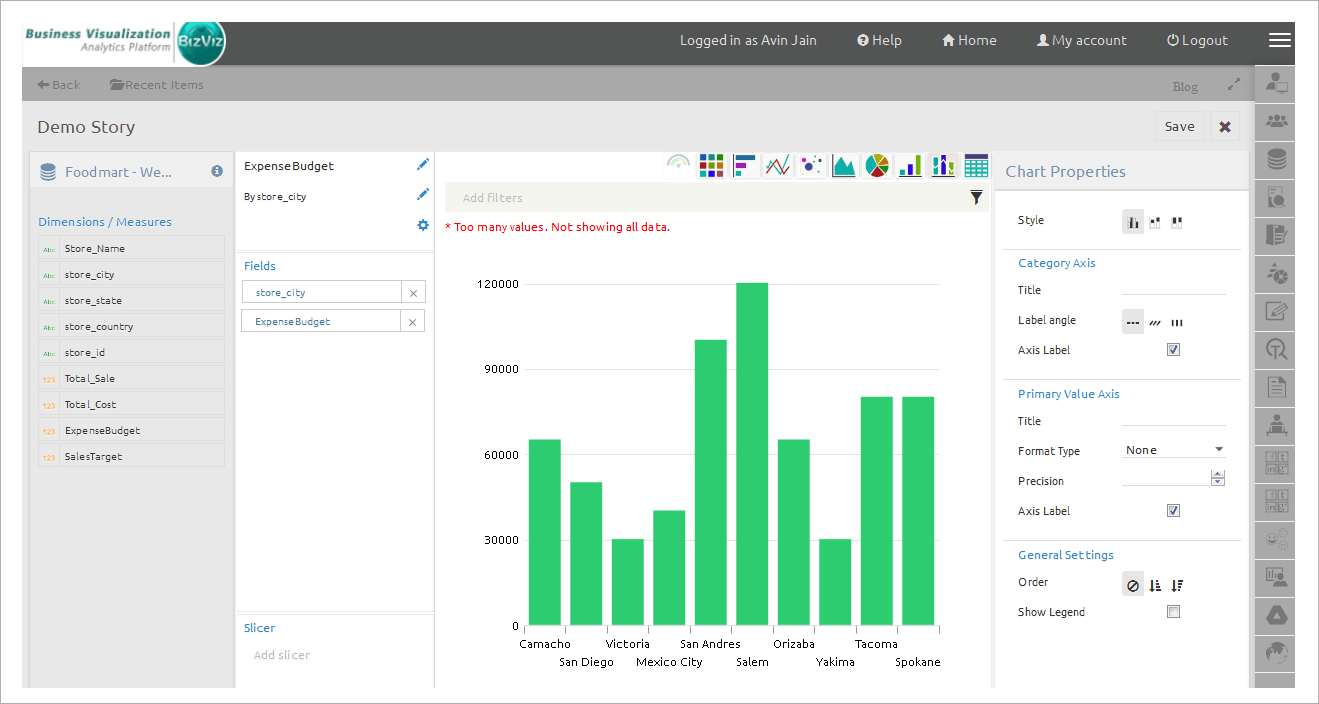
- After connecting to the cube click on the next to move forward to create a story. By dragging and dropping measures and dimensions in to the field column BizViz Business story automatically picks-up's the right chart for the given data and also provides chart suggestions.
You can do cosmetic customizations to the charts by using char properties option which can be viewed next to the chart. Global filters can be created by clicking on the filter icon.
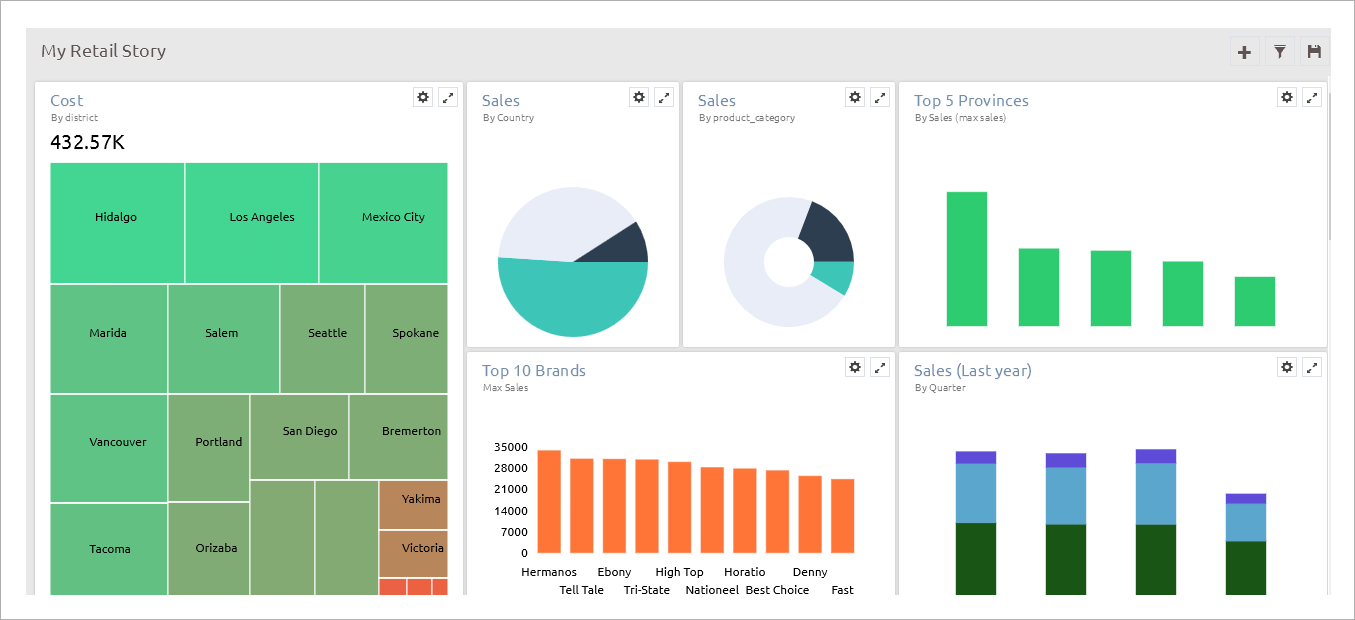
You can rearrange the charts just by dragging and dropping Once the story is created you can share with your peers.