A Guiding Line for current and future Data Analysts
From kindergarten to higher education, from enrollments to scholarships and completion of degrees; the sources of an education industry involve vast, diverse, and rapidly growing data. What if transforming, cleaning and analyzing the data are made easy? What if results obtained are communicated with high-level visualization and suggestive conclusions. Yes, all this is now possible with BDB platform.
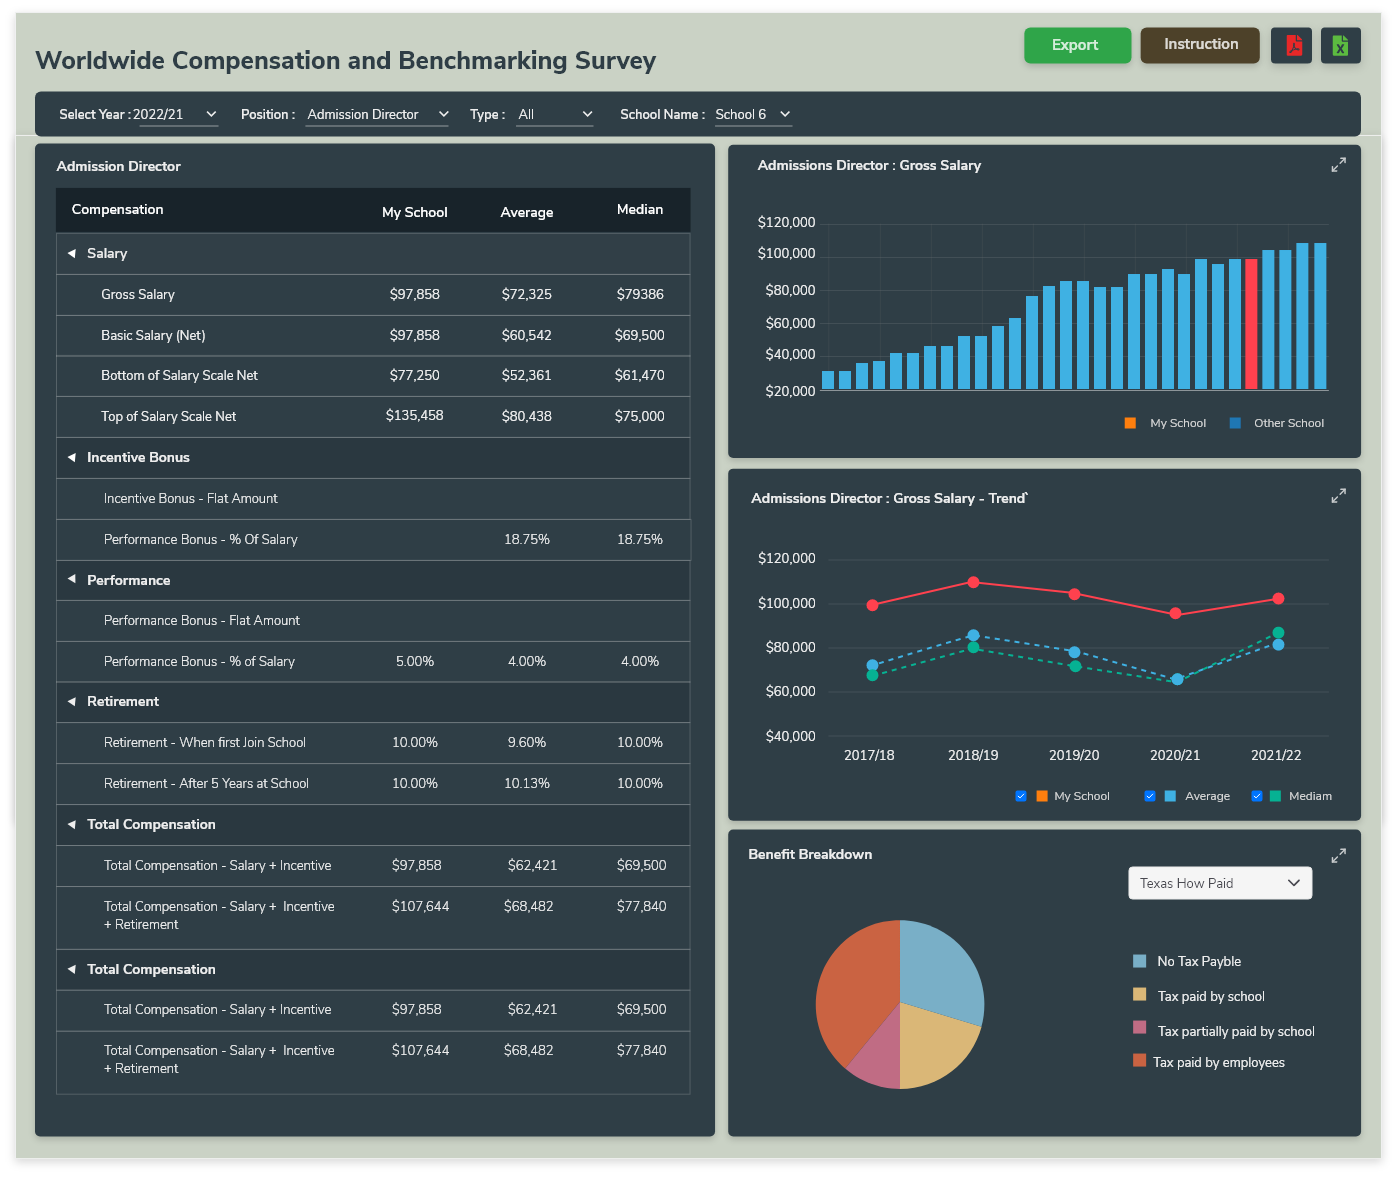
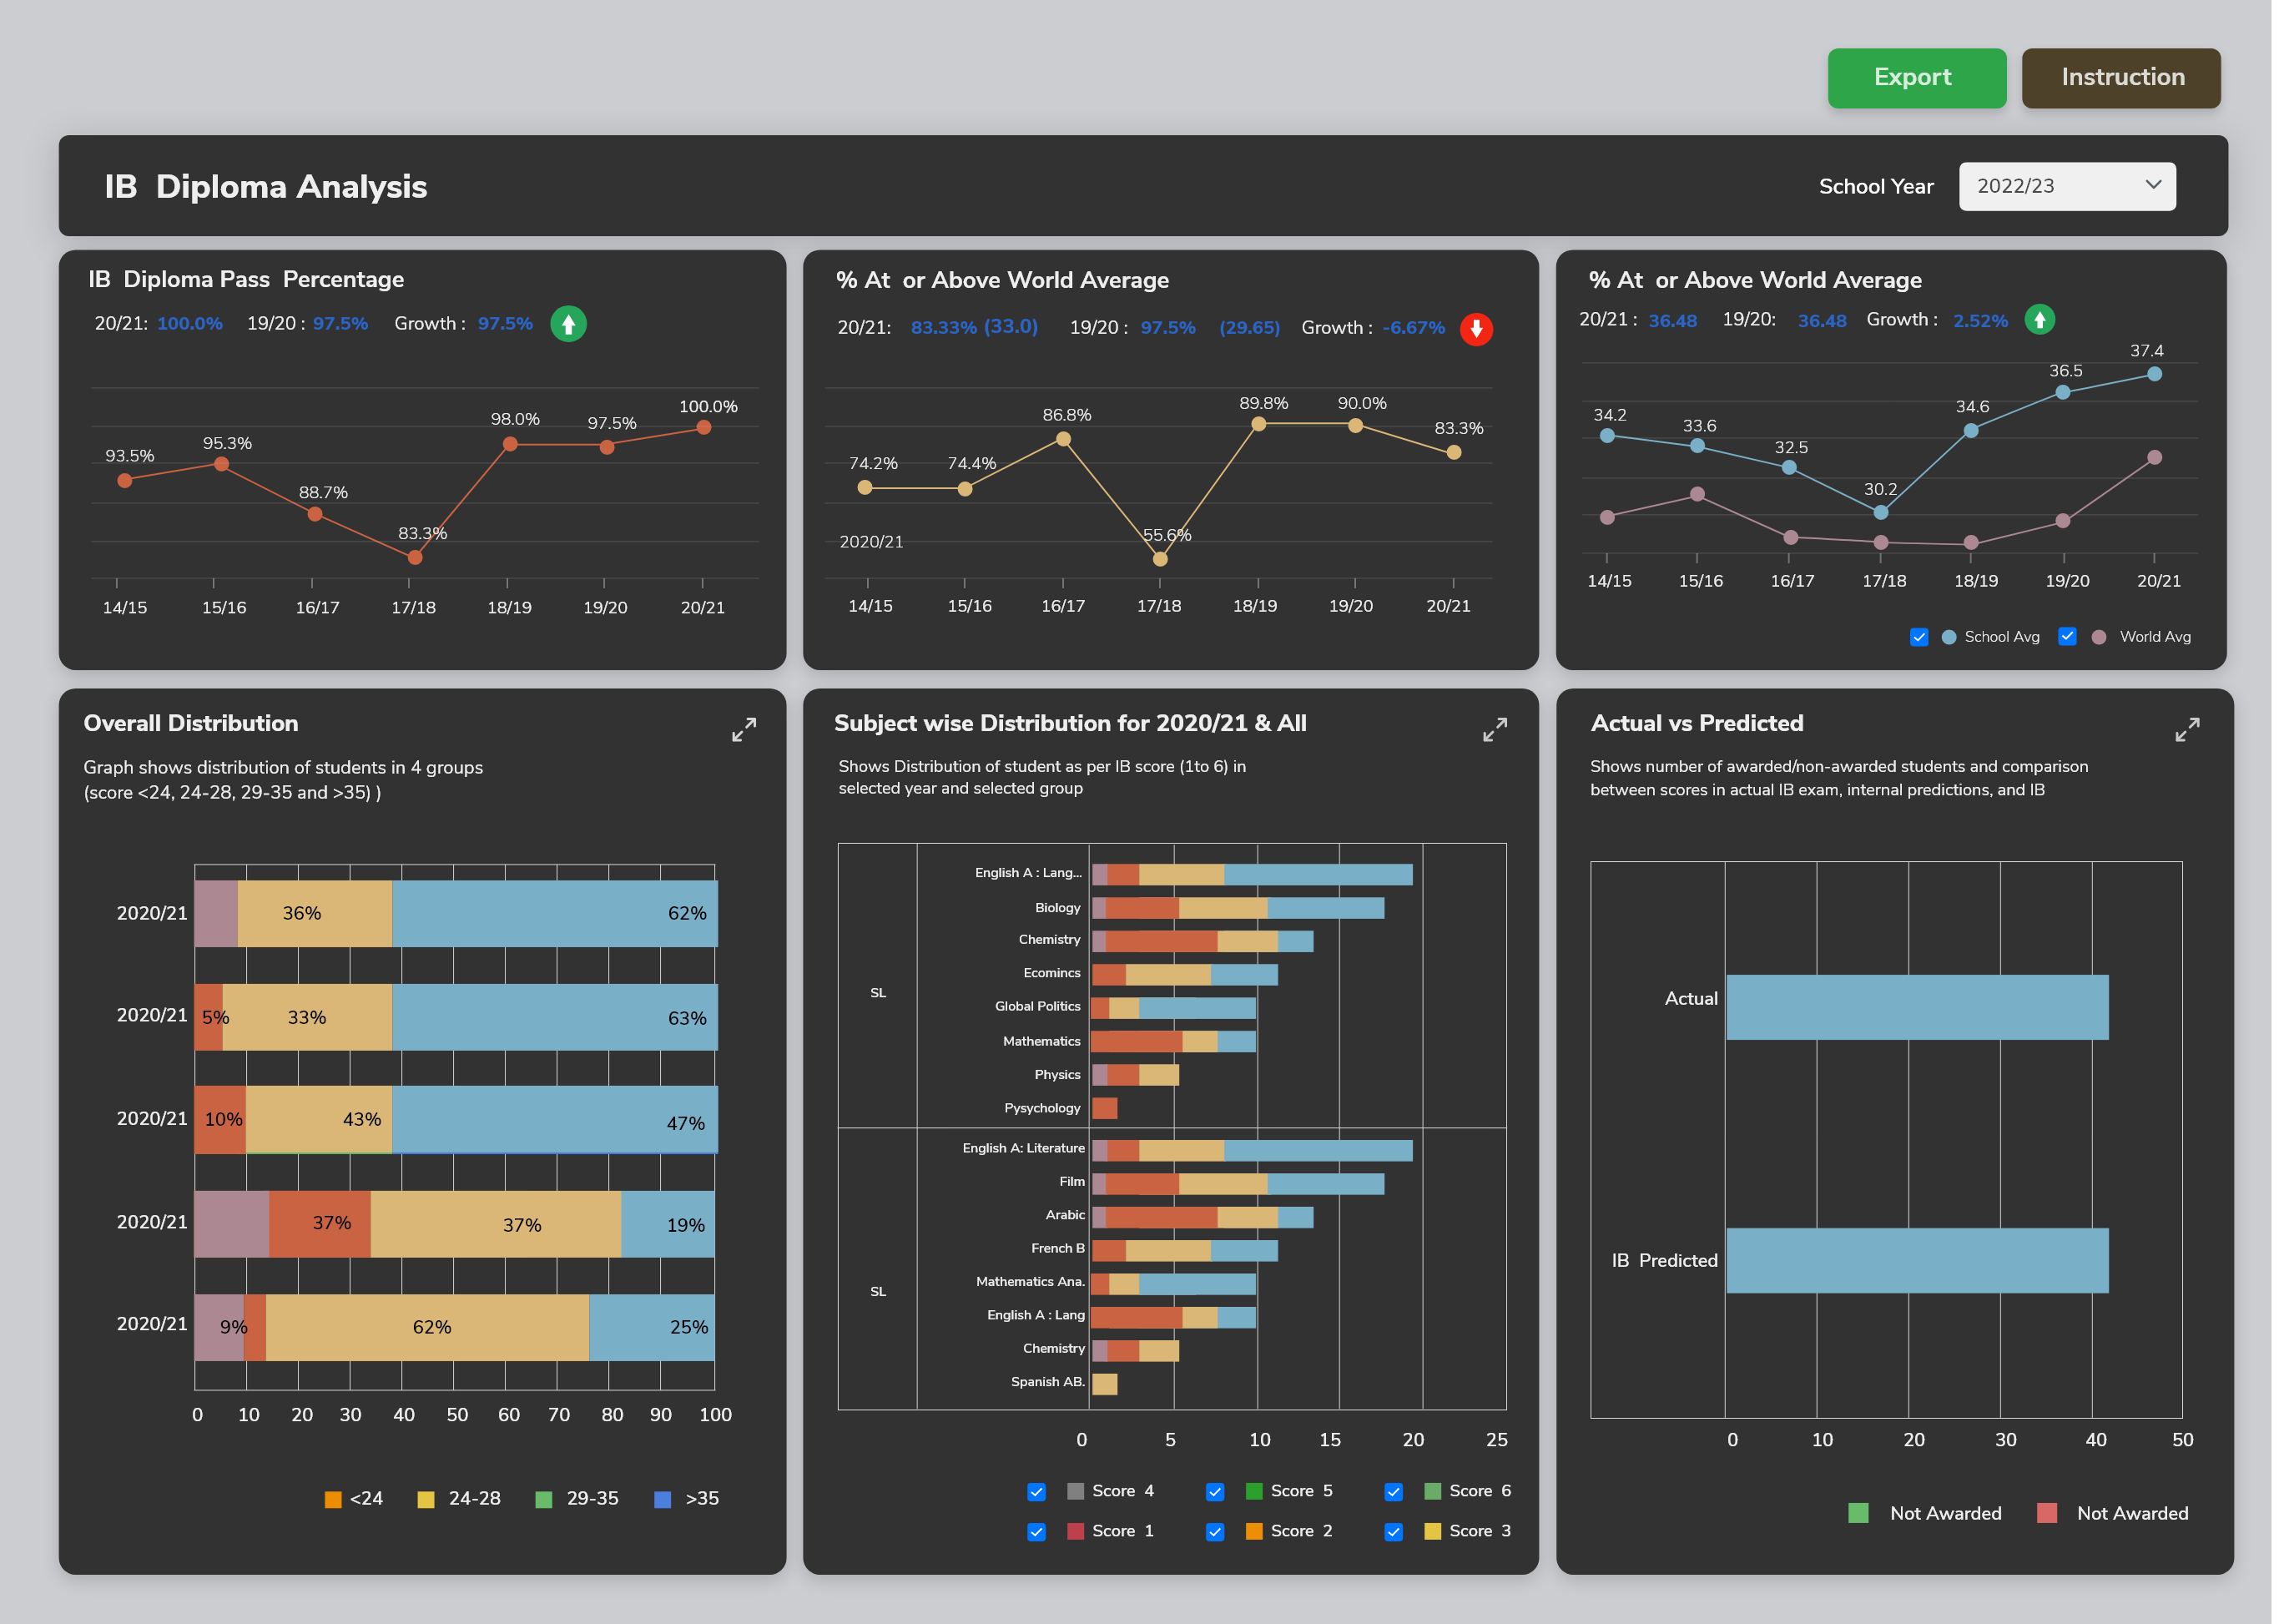
Concerning the needs of various user levels in an educational institute, there are numerous user roles available to manage a variety of users like Teacher view, Student view, Cohort view, and Custom NWEA International Partners Data Dashboard. BDB Platform offers standard and customized (based on the specifications of an institute) solutions for the academic industry. BDB Platform has been providing useful insights to leading international school across the world about Admissions, Finance, Assessments, Student Satisfaction (Survey), and Student Dropout rate.
Key solutions provided by the BDB Platform
Measure of Academic Progress
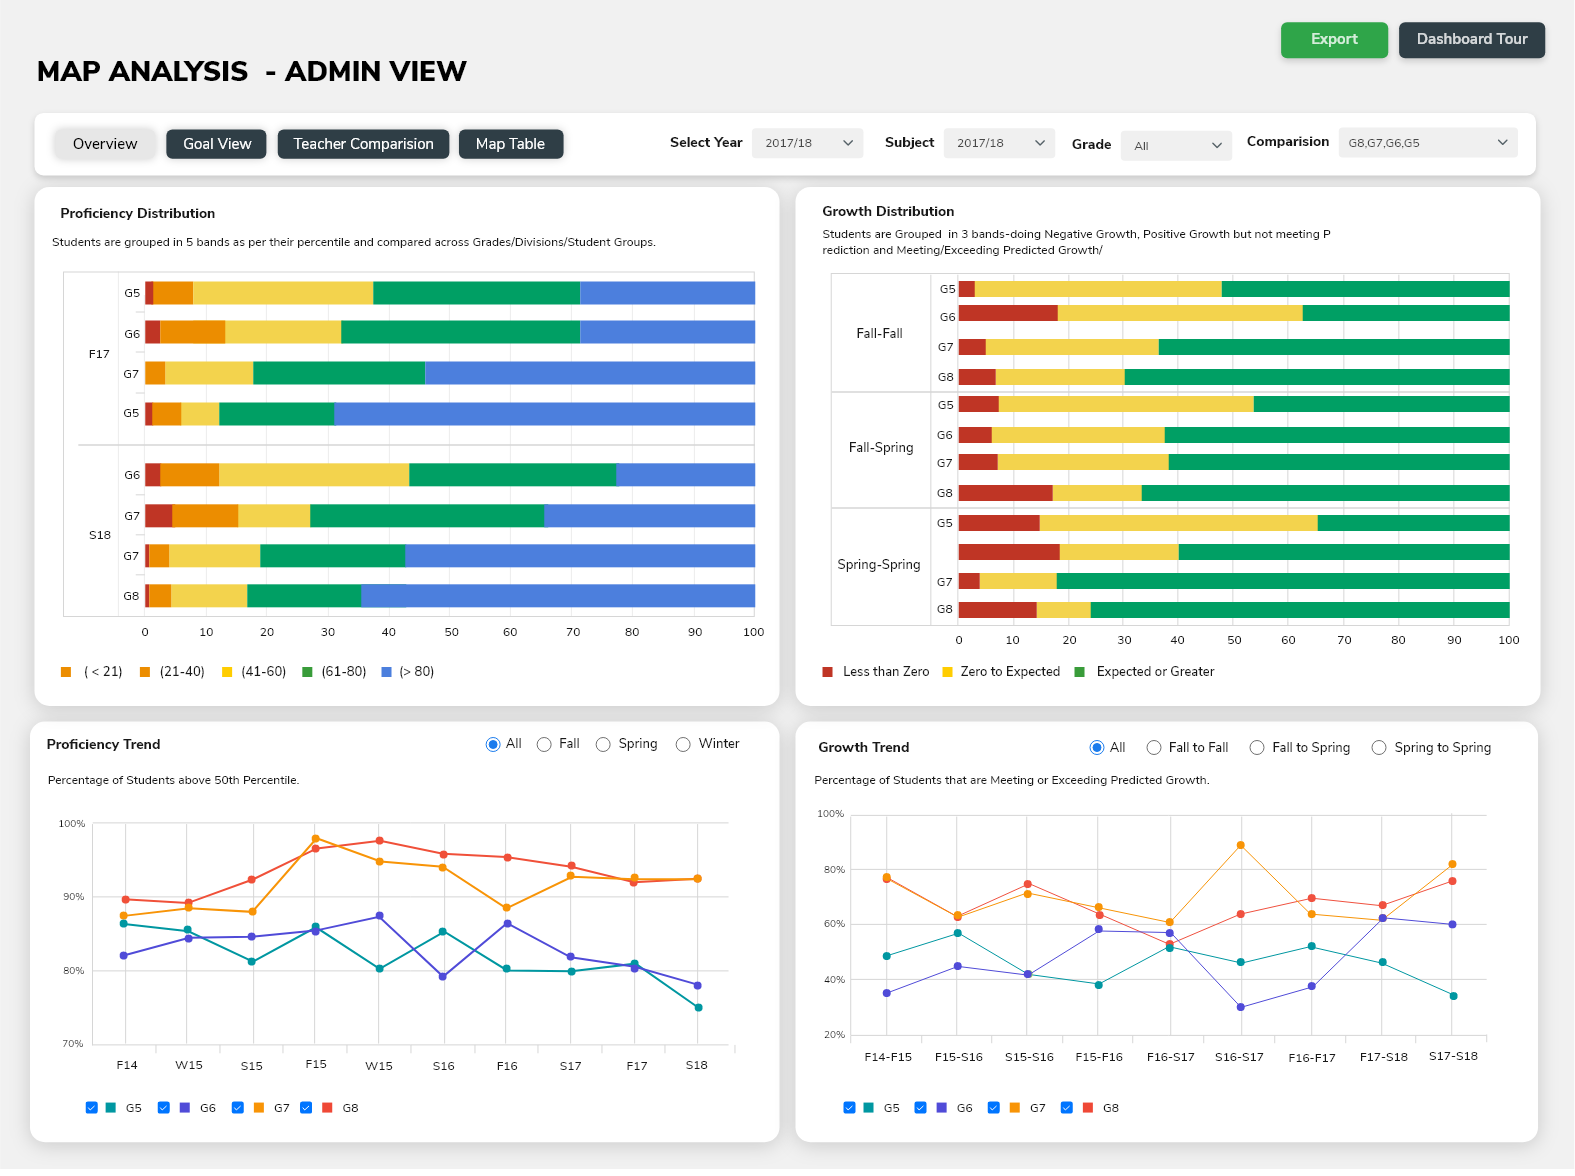
The MAP (Measure of Academic Progress) assessment offers in-depth analysis for teachers to track the performance and growth of their students. Teachers can drill-down to the see different trends in students’ growth and identify the students of various proficiency levels. There is Cohort Analysis to see the progress of the same student over a period and the Overall Analysis for the decision makers to see the progress of different school levels, grades, and classes.

Multi-Assessment Analysis
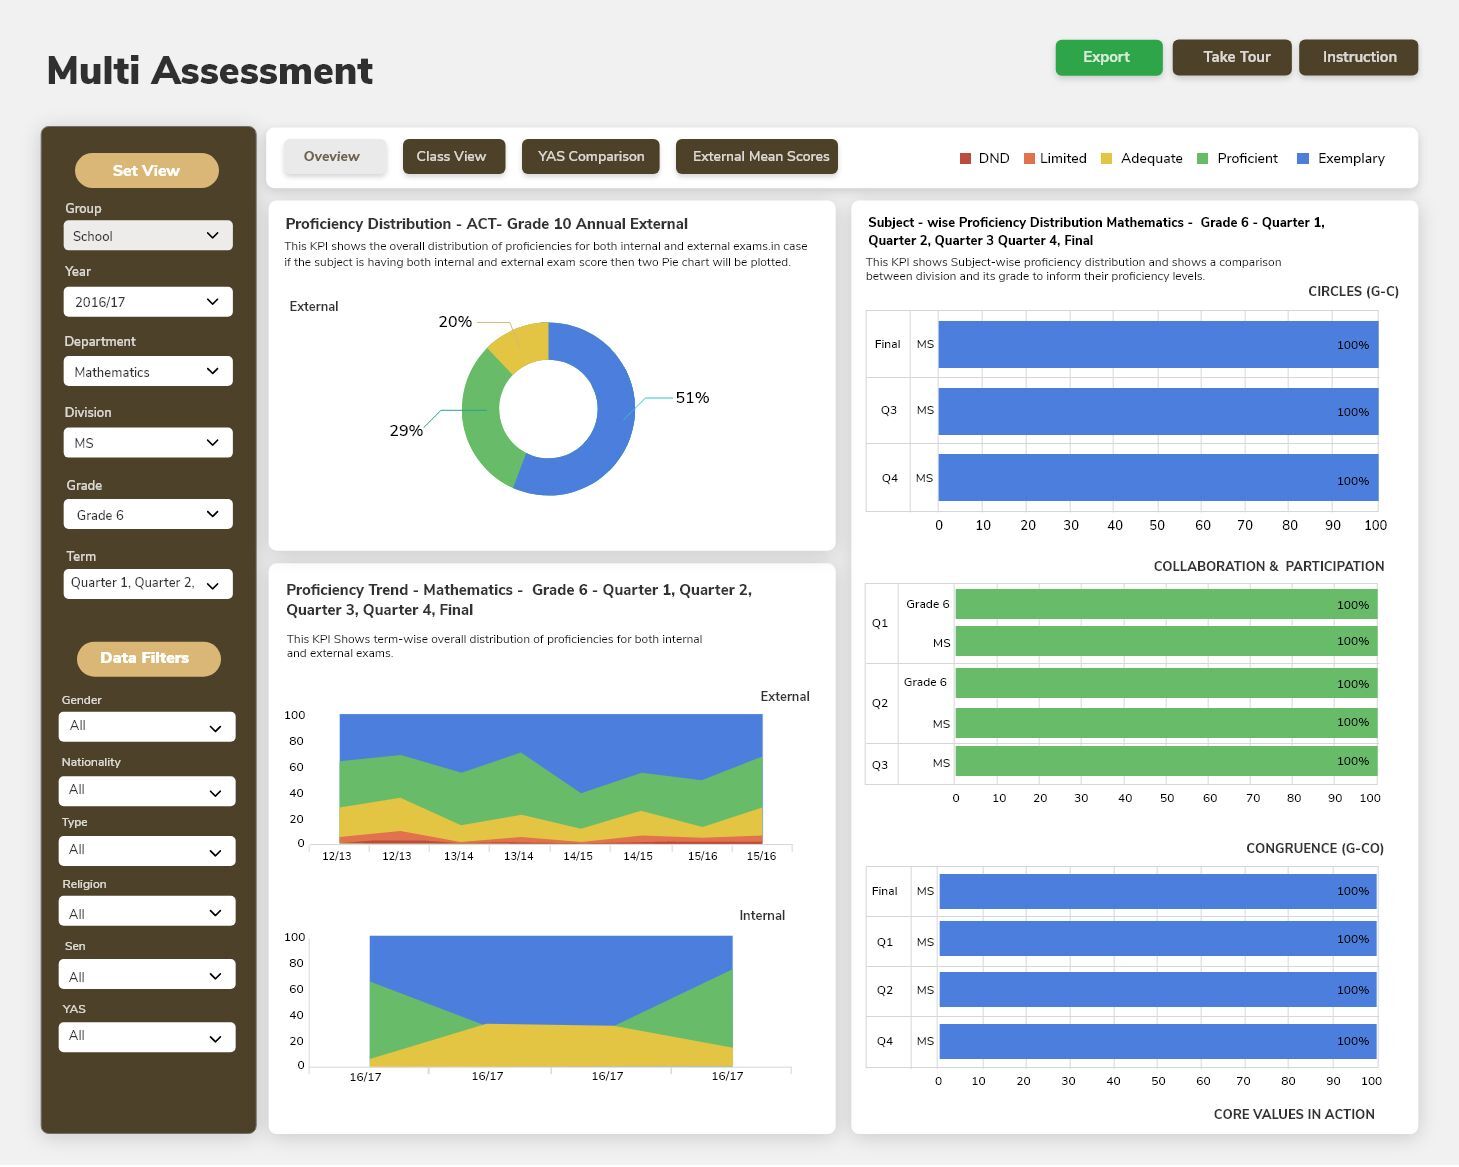
Get the consolidated view of all the assessments data (Internal or External) and measure the overall proficiency of school across different departments. The dashboards are customizable to define your proficiency level and normalizing the data to easily track the results of diverse learning programs that run-in the educational institutes. The platform easily consumes the exports from various systems to give a unified interface for in-depth data analysis and easy decision making. Get comprehensive analysis with our progress analysis tool to identify weaker, average, stronger areas of different grades and classes.

Scorecard
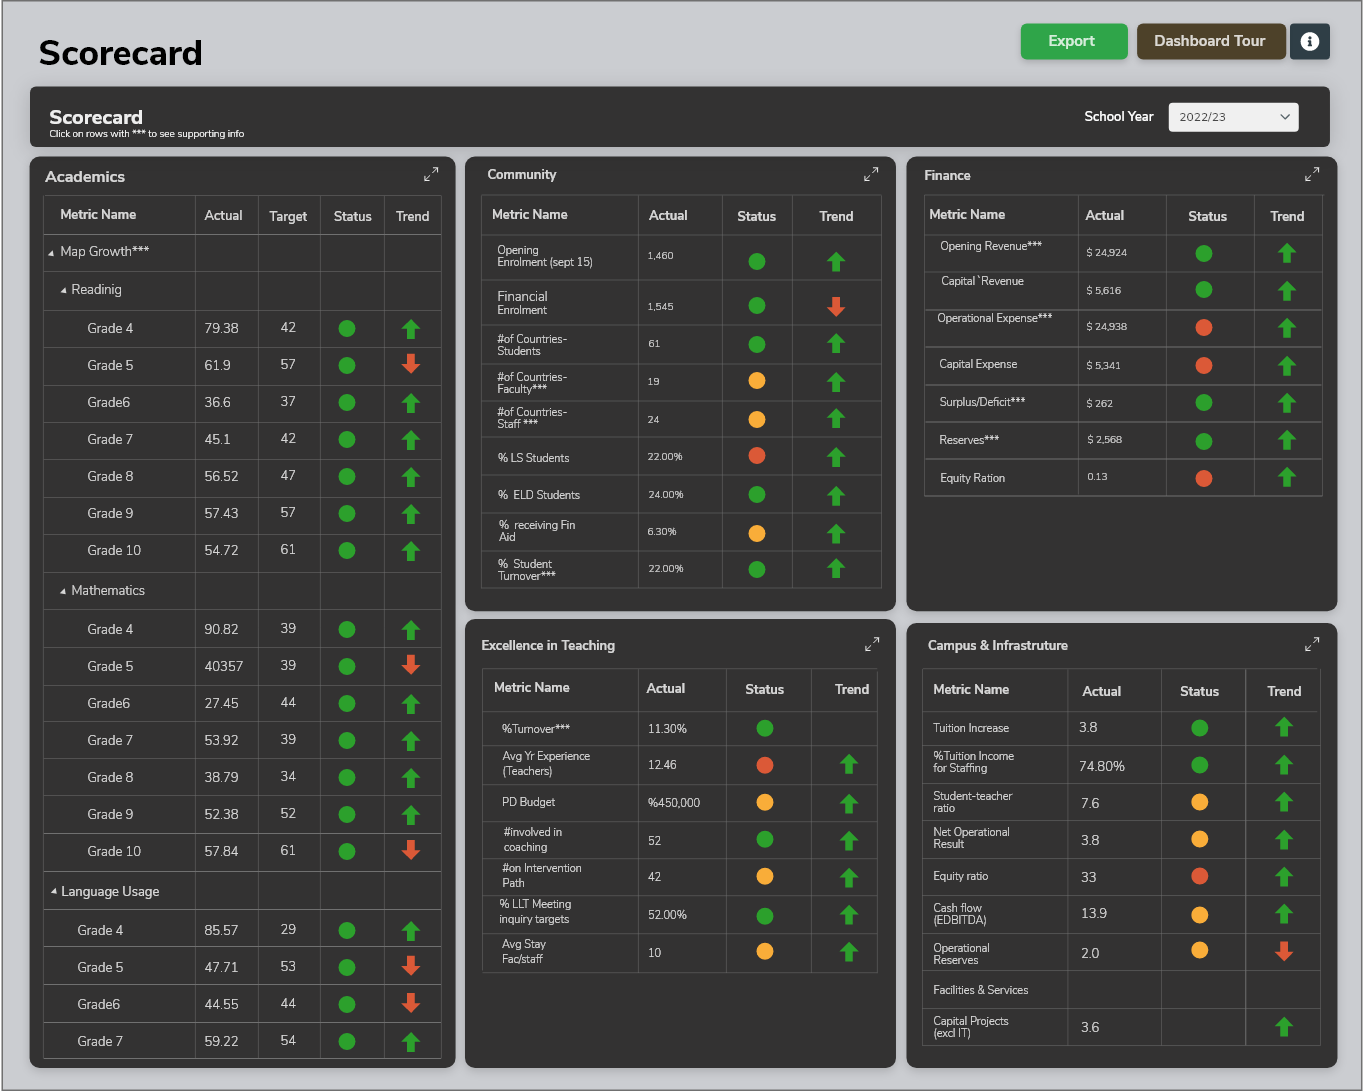
The Scorecard analytics measures the overall health of your school on a single page with different indicators to quickly detect the status of different areas. You can pick and choose from the library of hundreds of KPI’s and customize your design as per your area of attention. There are online forms available to easily track the KPI’s and receive real-time dashboard updates even with drill-down capabilities to view the supporting data for the general trends and other statistics.

Survey
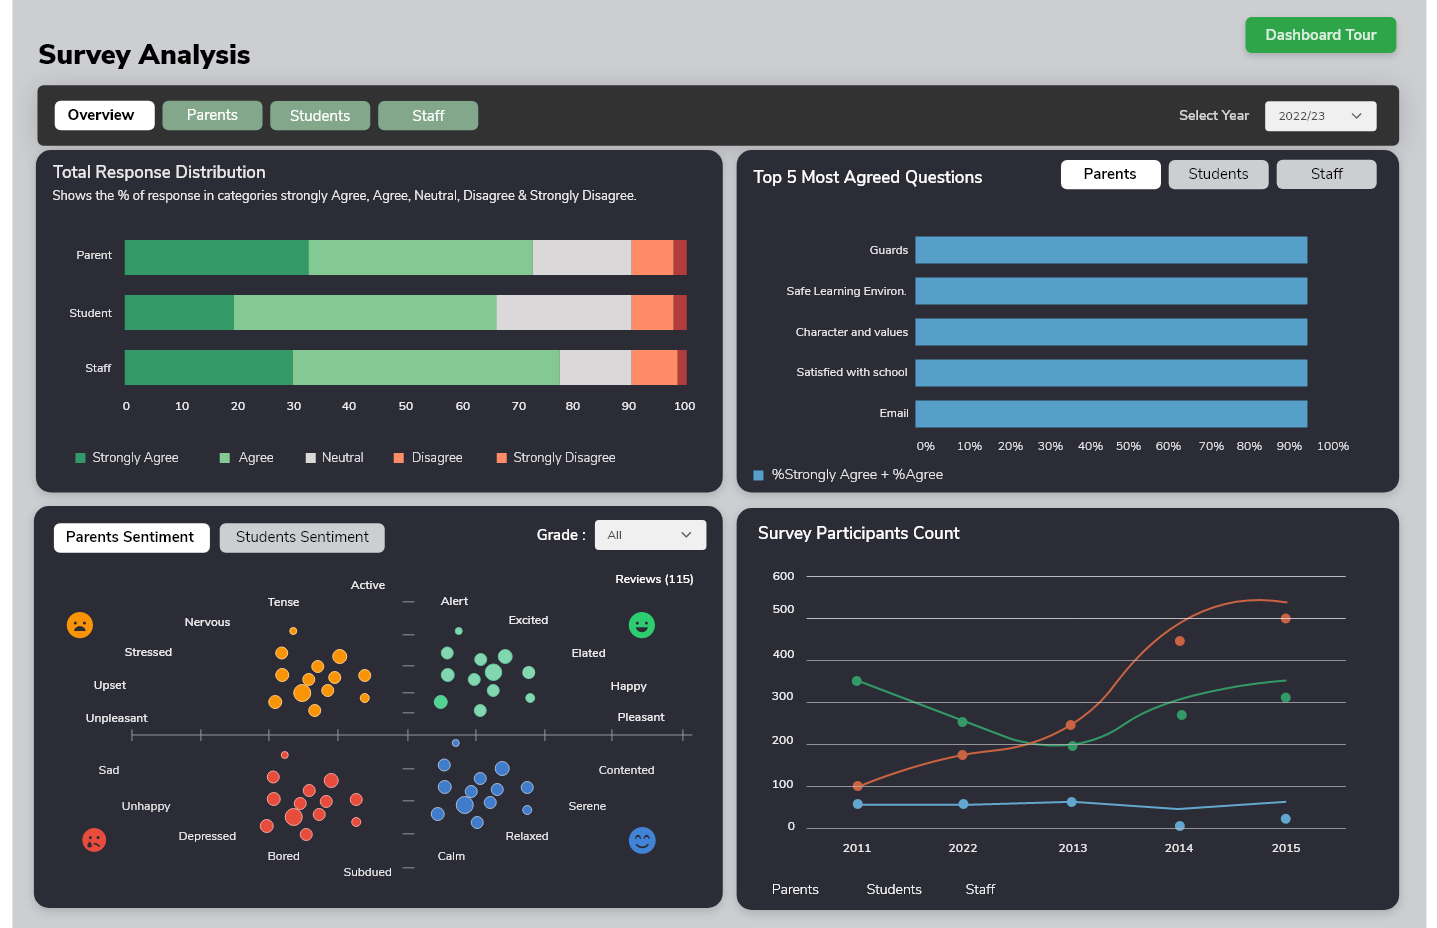
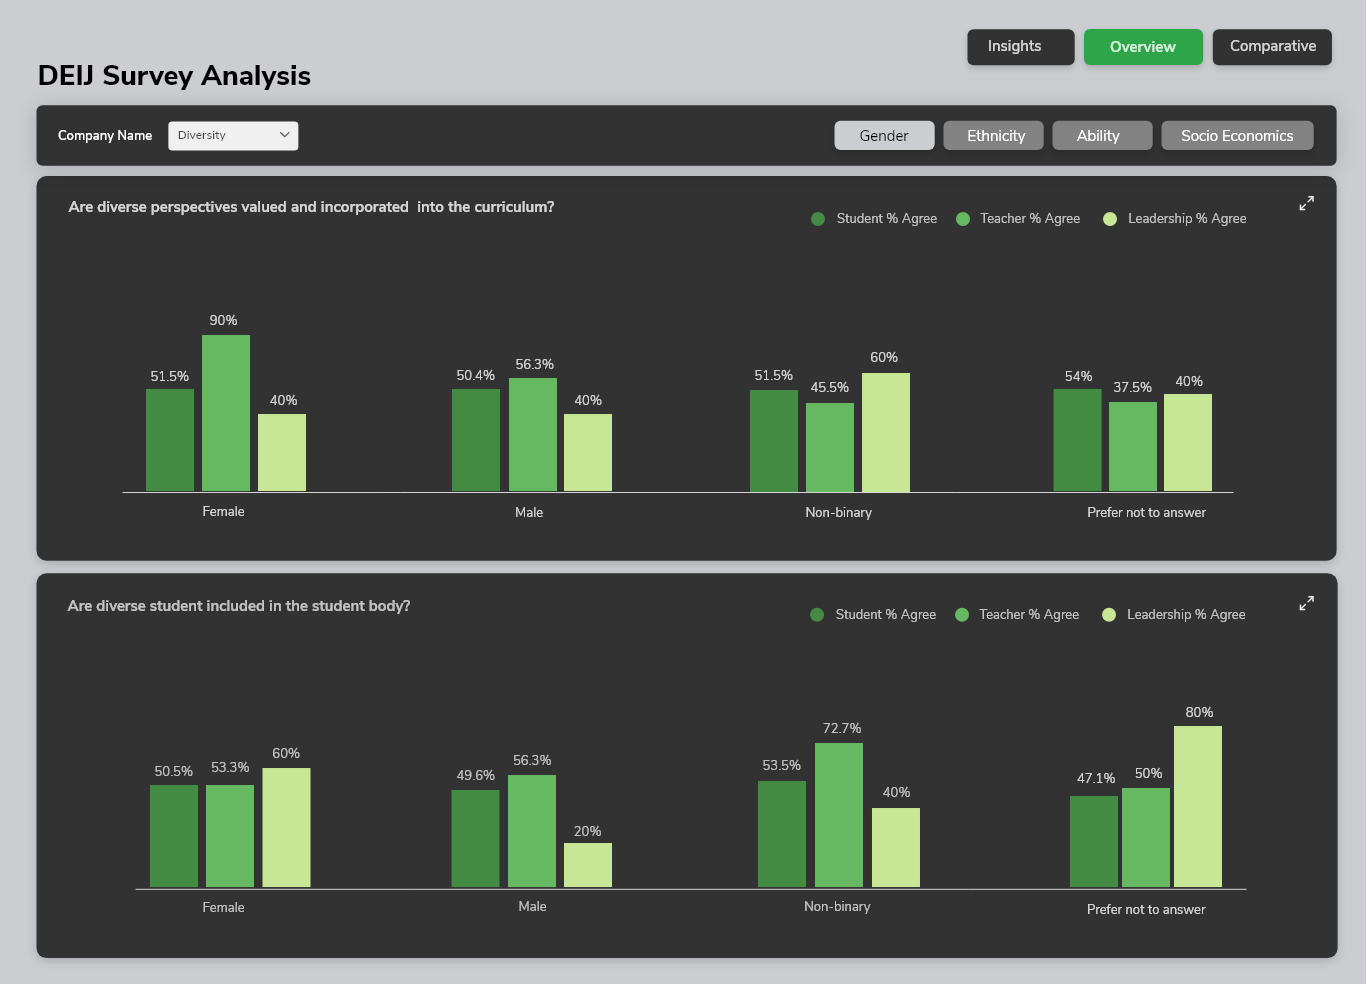
A single stop to collect, analyze, and perform a survey for various users’ roles like a parent, teacher or student. The users can view the in-depth analysis of ratings, textual comments, feedbacks, opinions within a stunning dashboard wherein the historical data is also available at the same place for comparative scrutiny. The BDB Platform facilitates the users to ask the right set of questions while creating and administering an insightful survey. Apart from departing excellent data analytics BDB platform has also been picked up by the academic institutes to educate their students in the field of digital data analytics. The BDB Platform is currently used by the students to overcome the challenges of understanding and applying the algorithms in their process to be resourceful and industry ready data scientists. As per statistics, in the field of data analytics, out of 100- there are 60 jobs available for data wrangling, 30 for data visualization and only 10 for a data scientist. BDB is playing its role in developing a strong base for the efficient Data Scientists the future Data Scientists to be job ready as per the contemporary demand and be resourceful Data Scientists.

KPIs of BDB Education Analytics

Proficiency Analysis
Analyze trends and distribution of proficiency levels of the teachers and students.

Growth Analysis
Examine trend of growth for different grades.

Goal Analysis
Visualize the trends for growth for the chosen subject, for selected grade and teacher.

Total Response Distribution
Survey based response analysis of students, parents and teachers

Sentiment analysis
Monitor overall sentiment of surveys conducted.

Attrition analysis
Check the ability of the management to retain the students and staff.