


Area
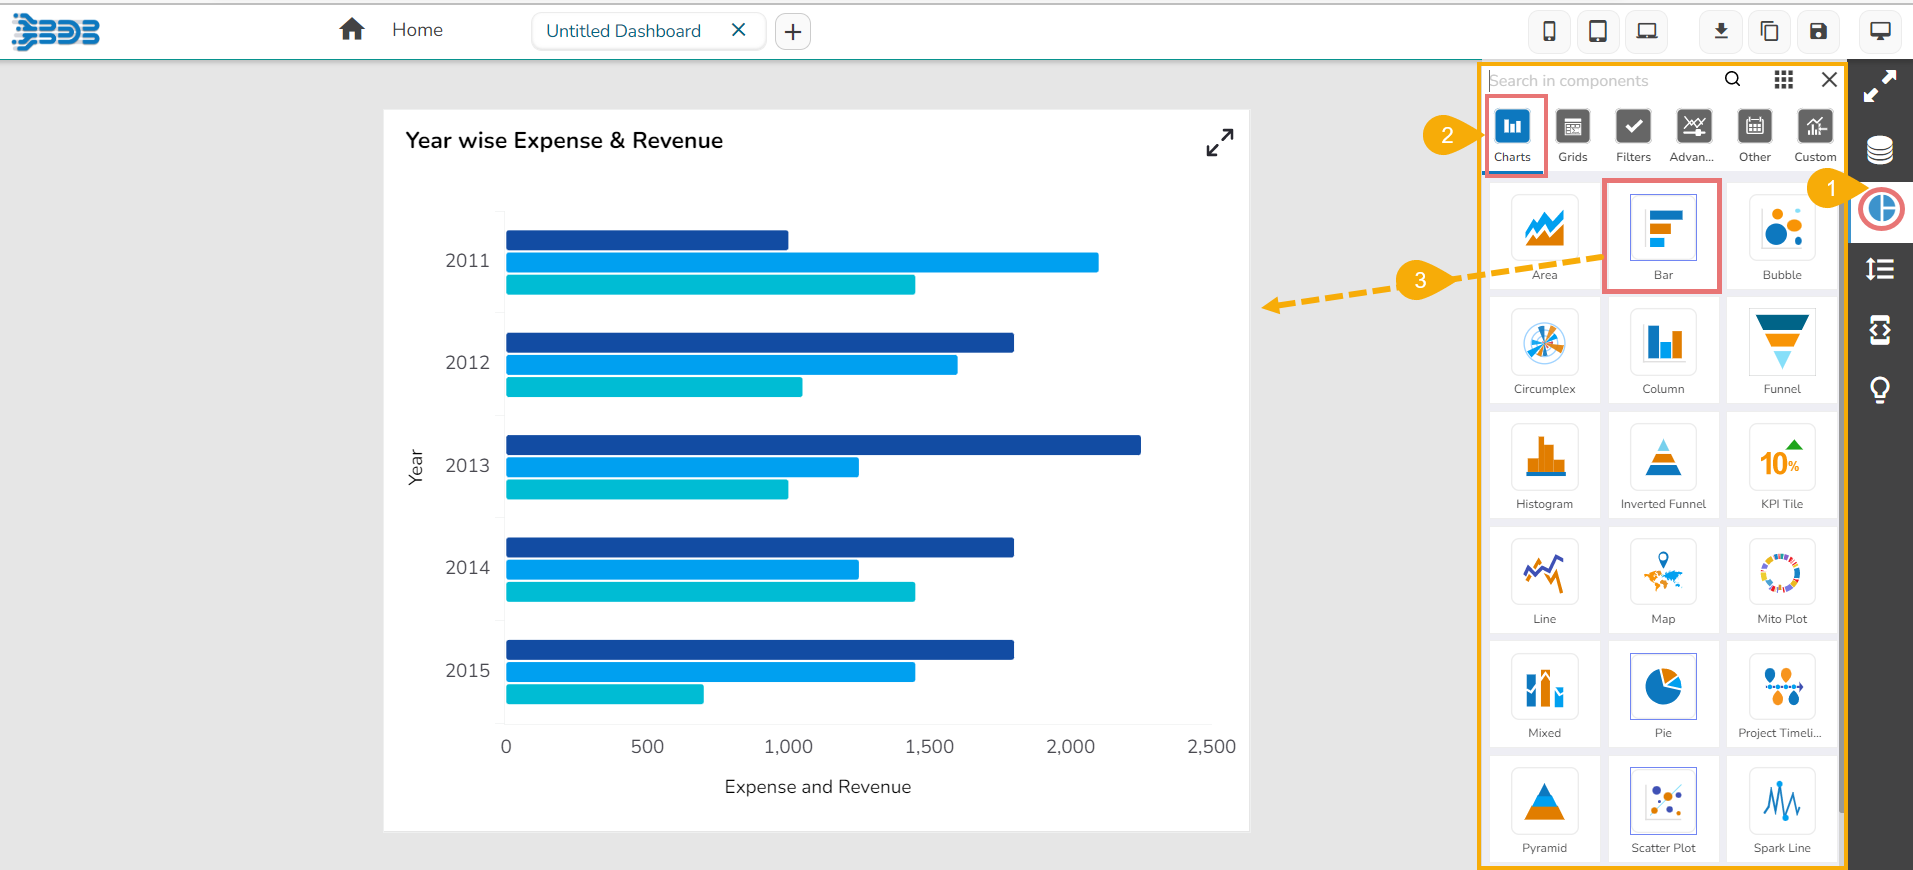
Bar
Bubble
Circumplex
Column
Simple Funnel Chart
Histogram
Inverted Funnel
KPI Tile
Line
Map
Mito Plot
Mixed
Pie
Project Timeline
Pyramid
ScatteredPlot
Sprkline
Spider
Water fall
Data Grid
Paging Grid
Data Sheet
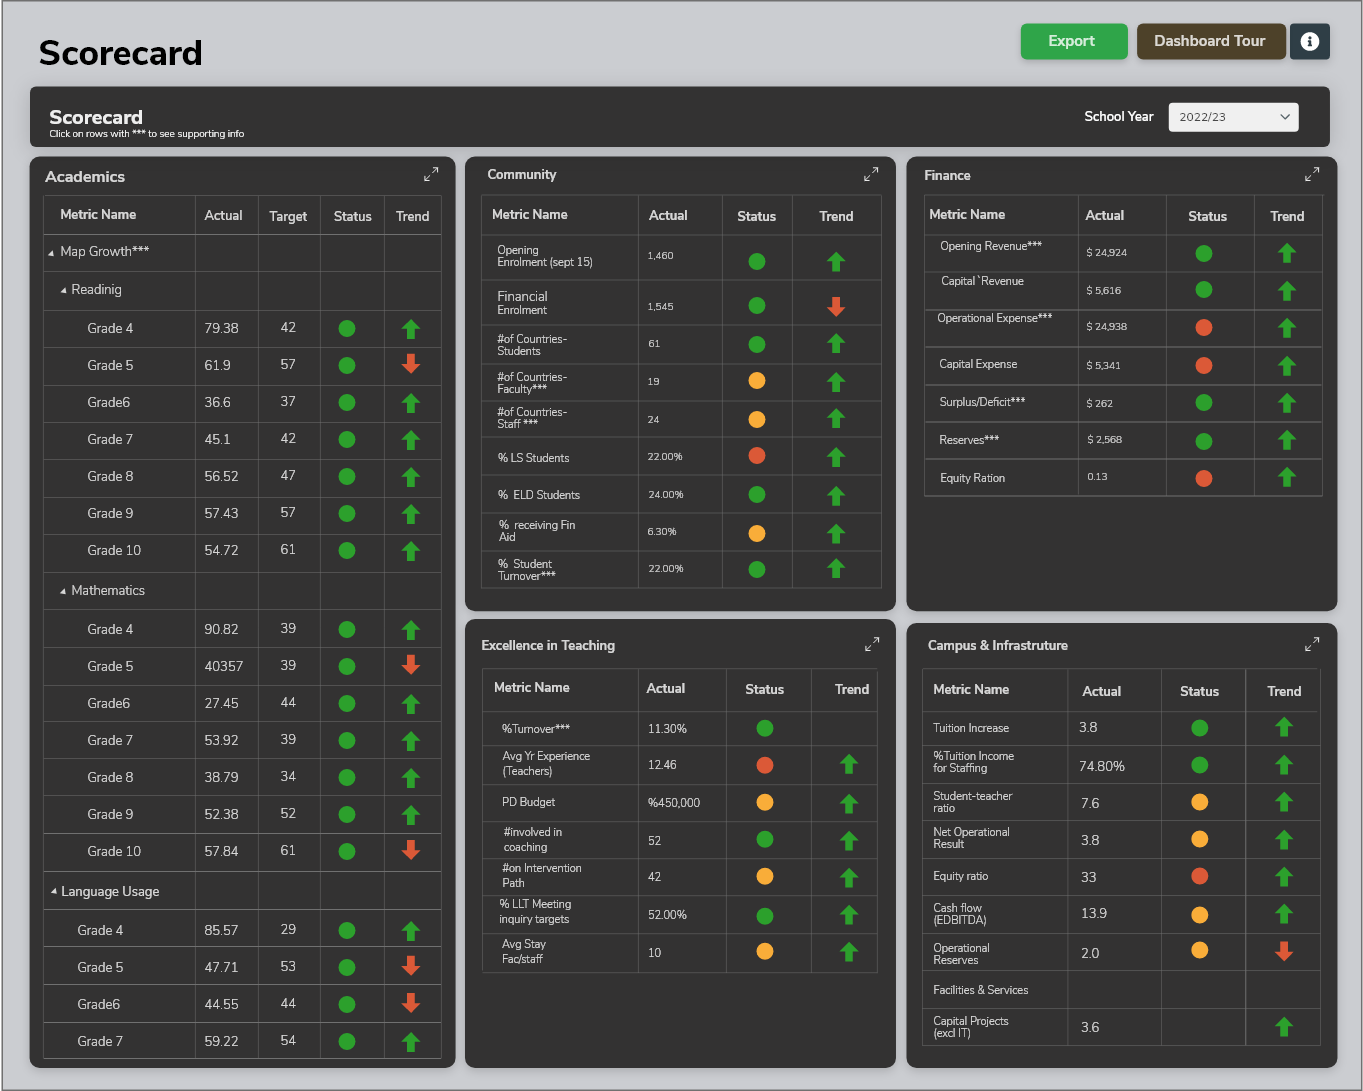
Score Card
Pivot Grid
Checkbox
Combo
Hierarchical
List
Radio
Box Plot
Candle Stick
Chevron
Data Search
Decision Tree
Group Bar
Group Column
Heat Map
Sankey
Text Analyzer
Time Series
Decomposition
Knowledge Graph
Tree Map
Trellis
Word Cloud
New Word Cloud
Custom Chart
D3 bar
D3 Decompositio Tree
D3 Network
D3PackedBubble Bubble
D3 Tree Map
D3 Violin
D3 MultilevelPie
D3 Word Cloud
D3 Line
Label
Legend
Trend
Filter Chip New
Graphics
Guided Tour
H Slider
Image
Info Button
Input Box
Input Button
Numeric Stepper
Progress Pie
Semi Guage
SVG
Tab
Text Box
URL Button
VSlider
Area
Bar
Bubble
Circumplex
Column
Simple Funnel Chart
Histogram
Inverted Funnel
KPI Tile
Line
Map
Mito Plot
Mixed
Pie
Project Timeline
Pyramid
ScatteredPlot
Sprkline
Spider
Water fall
Data Grid
Paging Grid
Data Sheet
Score Card
Pivot Grid
Checkbox
Combo
Hierarchical
List
Radio
Box Plot
Candle Stick
Chevron
Data Search
Decision Tree
Group Bar
Group Column
Heat Map
Sankey
Text Analyzer
Time Series
Decomposition
Knowledge Graph
Tree Map
Trellis
Word Cloud
New Word Cloud
Custom Chart
D3 bar
D3 Decompositio Tree
D3 Network
D3PackedBubble Bubble
D3 Tree Map
D3 Violin
D3 MultilevelPie
D3 Word Cloud
D3 Line
Label
Legend
Trend
Filter Chip New
Graphics
Guided Tour
H Slider
Image
Info Button
Input Box
Input Button
Numeric Stepper
Progress Pie
Semi Guage
SVG
Tab
Text Box
URL Button
VSlider