Import Custom Charts into BDB Dashboard Designer
Introduction
The purpose of a dashboard is to provide real-time results by aggregating and extracting value from all the data you collect, otherwise known as your key performance indicators (KPI’s). It simplifies your data into more manageable chunks of visual information that allows you to see what you are doing right and where you need to improve. When utilized properly, dashboards can help you make informed decisions that can dramatically impact your business performance.
Almost every business can benefit from having a dashboard. Large organizations consider multiple dashboards for different departments to keep track of internal and external KPIs in real-time.
You might be wondering if you really need a dashboard for your business. Below are few signs it might be time for your company to start using dashboards to keep track of your business performance.
- Feel that your company can improve, but you have no idea how to or where to start from.
- You are monitoring and tracking data but have no idea how to visualize them or how to make sense of it.
- You are lagging behind your competitors.
- The current solution which you are using isn’t giving you the ROI you need.
- You’re struggling to see all of your data in one location and in need of a data hub.
If you can relate to any one of these, it’s time for you to invest in a dashboard solution.
Graphical representations of data through dashboards communicate patterns, trends, and outliers far more quickly than tables of numbers and text. With visualization, users can spot issues and problems needing attention at a glance and take appropriate action. In text-based reports and spreadsheets, the trends and issues remain hidden among dizzying arrays of numbers and text. Because of its power to communicate, dashboards are now becoming more pervasive in any business environment.
We at Big Data BizViz has built a data analytics platform which would help you gain a 360-degree view of data with a self-servicing BI. BDB enables users to assemble data from multiple structured, semi-structured, and unstructured data sources. And help analysts provide Descriptive, Diagnostic, Predictive, and Prescriptive analytics. Self-service business intelligence form BDB is an approach to data analytics that has enabled business users to access and work with corporate data even though they do not have a background in statistical analysis, business intelligence (BI) or data mining.
BDB Dashboard Designer is a web browser-based application used to build dashboards and design analytics. It comes preloaded with a wide range of charts, features, and data integration capabilities that empower the users to create informative and appealing visual representations of their data. The ability of BDB's platform to go deeper than standard KPIs and analyse them has given immense benefits to multiple businesses across industries.
Using BDB Dashboard Designer users can save and publish splendid visual reports as dashboards. Display informative progress report of any business process containing series of attractive visuals to denote the business data. The Drag and drop functionality offered by our dashboard designer gives you access to a comprehensive view of relevant KPI’s regarding your business objective.
What’s new with our BDB Dashboard Designer?
To develop more productive and appealing dashboard, developers have to explore and use multiple types of charts and graphs provided within the platform by the BI vendor. In addition to the chart templates provided within the platform, dashboard developers are looking for even more attractive and engaging charts.
Even though few leading BI vendors have provided options for this by adding a chart store within their platforms, for which the users have to pay and download to use them on their dashboards or reports.
BDB has introduced a new feature to solve this additional paying issue and to allow dashboard designers to create more customizable dashboards by giving them the access to import charts from any source on to our platform, apart from the inbuilt charts that we provide like Box Plot, Candlestick, Chevron, Group Bar, Heatmap, Text analyser, Timeline, Tree Map, word cloud, Trellis, etc.
This new update of the BDB's Dashboard Designer to import charts from any source on the web will allow users to enhance their data visualization according to their needs. It has also opened up ways for the BI developers and Analyst to carry out complicated analysis and visualizations with ease of understanding.
How does it work?
The custom component in the designer will enable users to add any third-party visual-components like charts into the dashboards, which consumes data from our inbuilt BDB connectors.
- Functional Requirement:
Dashboards should have the capability to import any custom component from any third-party library which can consume data from our BDB connectors and interact with other dashboard components. - UI Requirement:
A component which can be used to configure a chart should have properties to configure JS, CSS source files. Dataset can be taken from our BDB connectors and can set data and fields into the custom chart. - Dataset Requirement:
Any of the connector data can be passed to the component. BDB connects directly too many live data sources in real-time. As soon as your data changes, it will be automatically updated in the dashboard. You can blend data sources from different vendors and data suppliers in our BDB Platform to gain insight into your data. We also have multiple data connectors from various domains. - Operational Requirement:
Tooltip, Drill events should be captured and working same as BDB's charts.
Configuration Steps
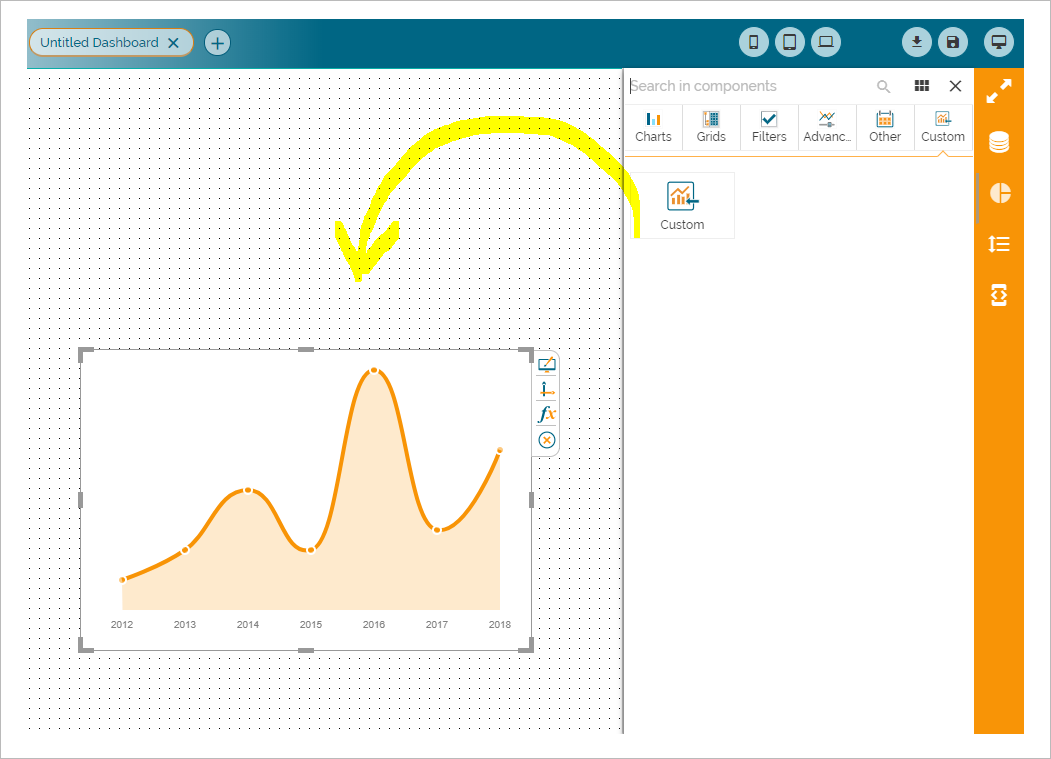
- 1. Drag and drop custom chart in designer area
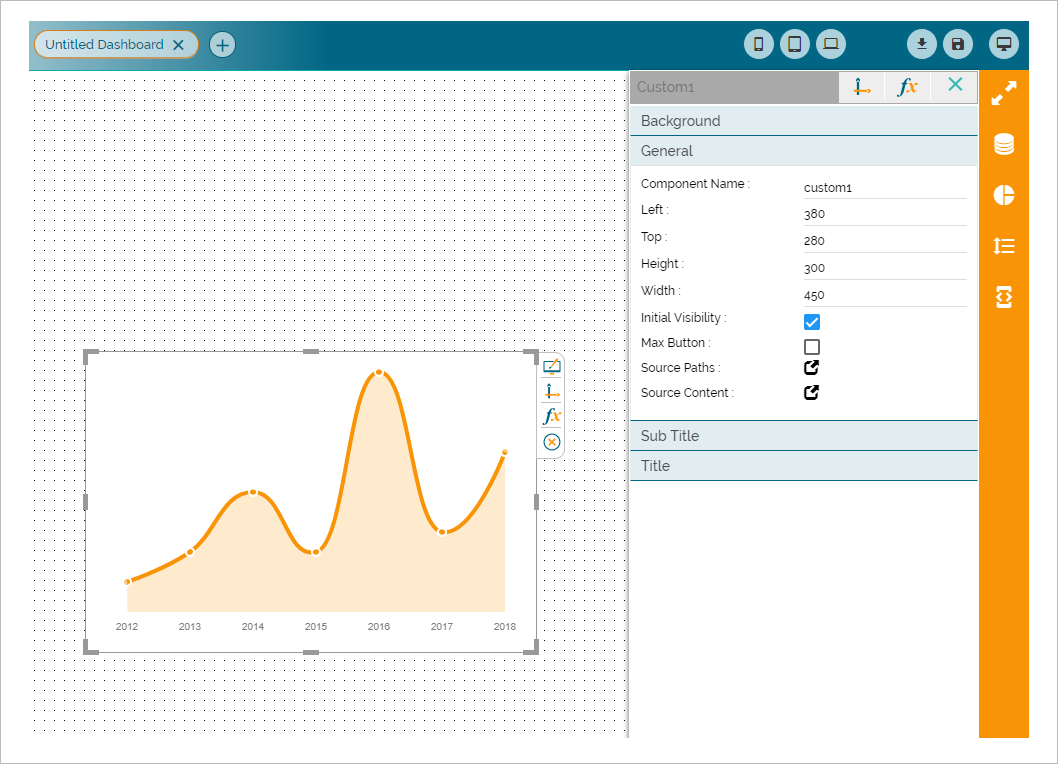
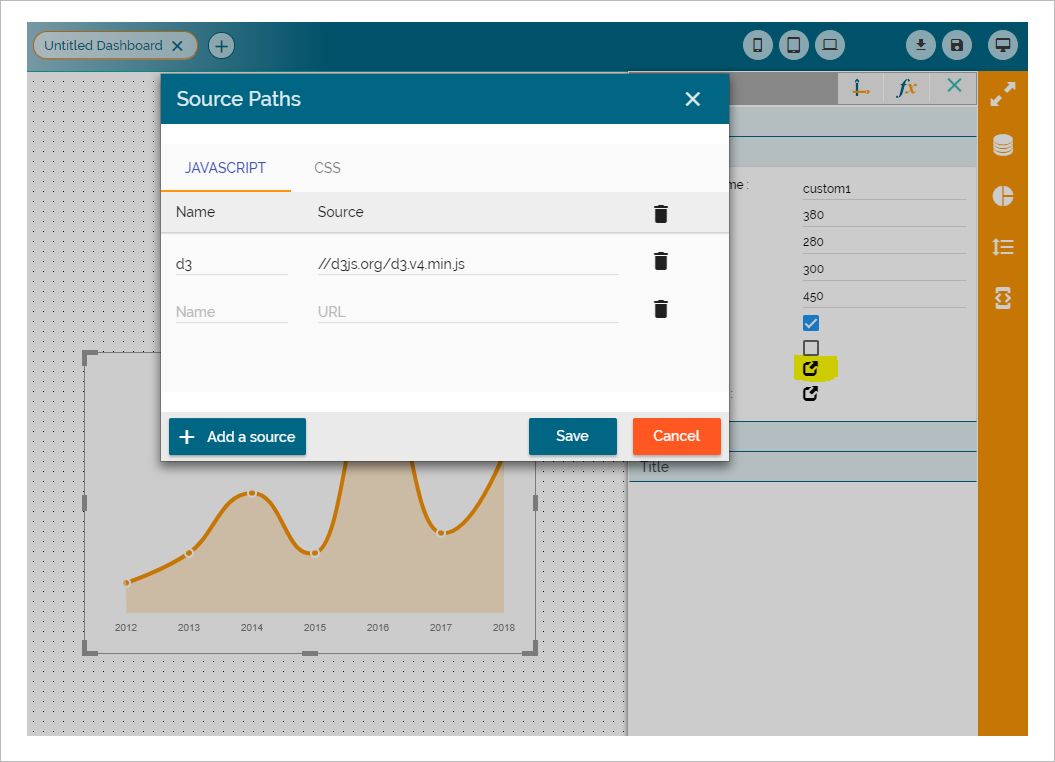
- 2. Double click on it will open property palette, under general section, click on Source Path icon, add the paths of JavaScript and CSS source files required for this chart.
- 3. Click on Source Content icon. In the HTML tab, add the html elements where the chart will be rendered or if additional html elements are required. Click on CSS tab and add the required styles for formatting of chart’s elements. Click on JS tab, add the script configuration code required for this chart and configure the events callback etc.
- 4. To access the properties set from property palette in custom chart configuration, we should use bizvizchart as reference.
- 5. Bizviz chart will be treated as reference to the CustomChart object which is part of dashboard.
- 6. Using this reference, we can access the data and other properties in the chart configuration.
Examples: bizvizchart.getData(), bizvizchart.getFields(), bizvizchart.getWidth(), bizvizchart.getHeight() are the methods. Bizvizchart.chartJson will gives the access to entire configuration JSON done from property palette.
Snapshots of available feature in BDB Designer:
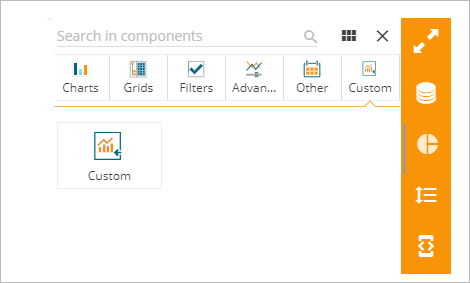
- 1. Custom Component in bizviz charting library
- 2. Drag and drop draw with static data
-
3. Property palette
-
4. JS and CSS source path configuration
-
5. JavaScript CSS and HTML content editor
-
6. Events method
-
7. Dataset palette
Demo Dashboard with multiple custom charts
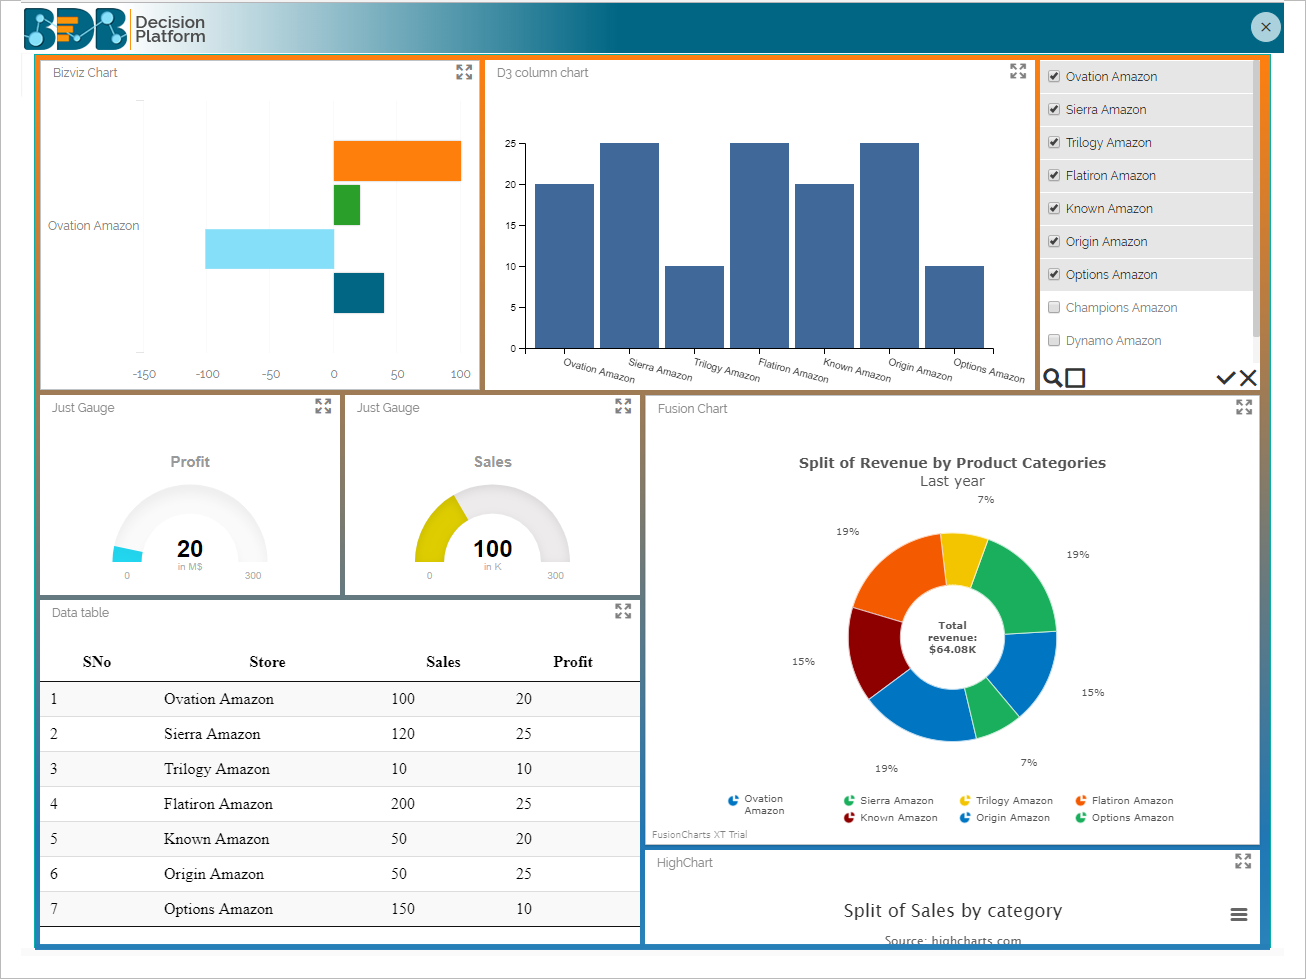
The below dashboard gives you an overview of how BDB's new feature can be useful for the dashboard designers. This demo dashboard which we have created has our own BDB chart and charts from three different third-party charts provided like D3 charts, High Charts and Fusion Charts. All the charts are interlinked to each other using our BDB connectors according to the dashboard requirement.
CLICK HERE TO CHECK THE LIVE PREVIEW OF BDB’s DASHBOARD DESIGNER IMPORT CUSTOM CHART FEATURE
Conclusion:
We at BDB are always focused on building and delivering products which give users the complete power and authority to customize according to their usage requirements. That's been the reason for us to build a self-servicing BI with easy integration capabilities to multiple data sources using BDB connectors through our data pipeline architecture.
This particular new update of BDB to import custom charts into the dashboard designer will encourage developers to create more attractive dashboards with compelling visualization. That would help the organizations achieve the goal, of employees looking into the dashboard more often to get insights into various day to day operations and functions across the organization.