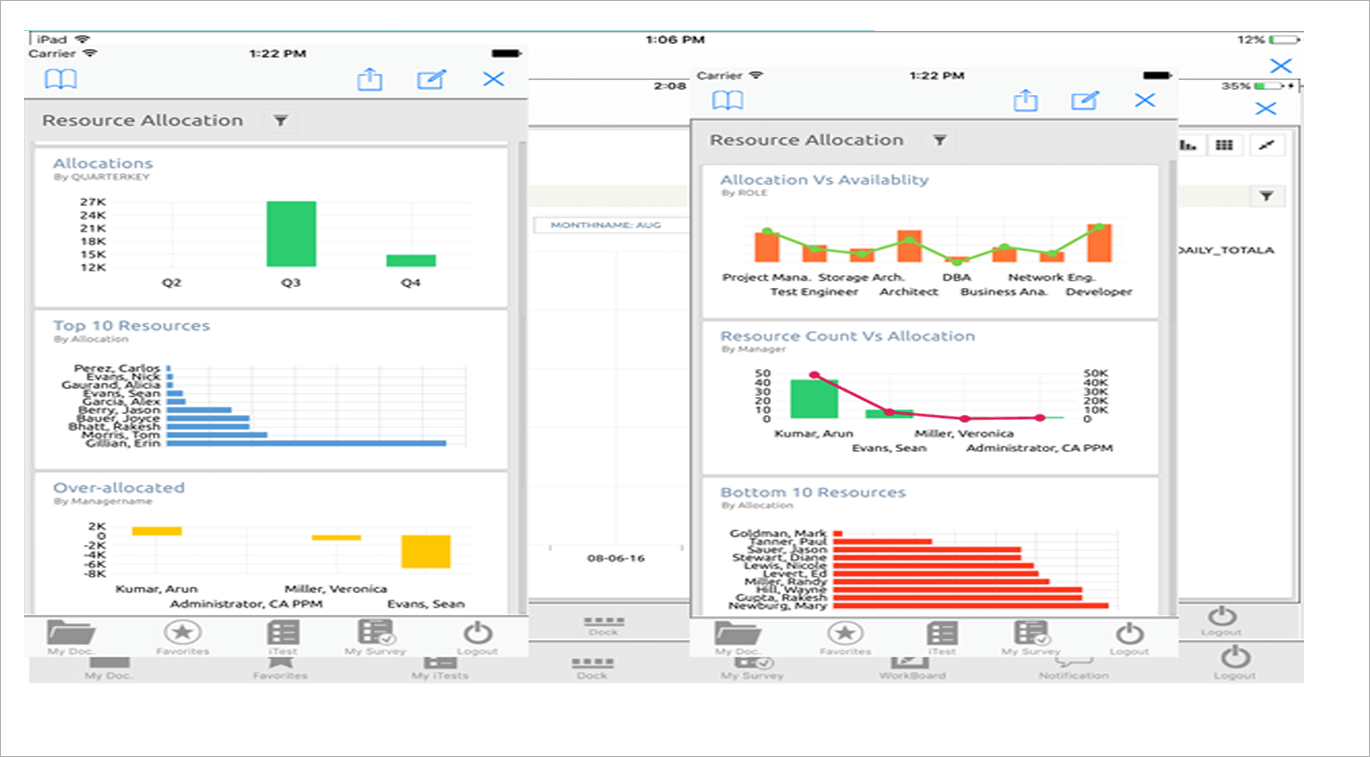
BDB CA PPM Analytics Integration

We bring Clarity to your Project Portfolio
Management.

BDB communicates directly with CA PPM

It uses web service, gets a list of active users, leverages the CA PPM security model ensuring that all data shown is based on security rights. You can also leverage Active Directory or another application. Thus we bring Clarity to your PPM. Administrators can embed the dashboards in the corporate intranet, CA PPM or SharePoint.

The Problem Statement

CA PPM used to have SAP BOBJ Integration earlier. CA is now building Jasper Plugins to meet the customer’s requirement which wasn’t the case with SAP BOBJ Jasper has poor reporting capabilities as compared to Crystal Reports. Jasper Ad-Hoc capabilities are quite inferior to that of WEBI Jasper’s basic dashboard features Xcelsius, being an advanced tool for dashboarding.

CA PPM 14 version is an HTML5 Compliant version, so CA needed a new version of SAP Products like Lumira etc.which didn't happen. CA PPM customers are Top 3000 companies of the world are customers of CA PPM and they are still on SAP BOBJ package since Jasper plugin doesn't provide strong BI features. Apart from all these , mobile capabilities are temporarily unavailable for Dashboards (Adv Vis.)

BDB CA PPM Features

CA PPM Package Contains
  • Prebuilt Dashboards
  • Prebuilt Self Service BI (Ad Hoc Analysis)
  • Jasper Reports integration
Salient Features
  • Integrated CA PPM Authentication and Authorization
  • CA N-SQL Query Services can be consumed 'as is'
  • Connectivity to the CA Data Mart
  • Mobility - Dashboards, Self Service BI
License Components
  • Dashboard Designer for Power User
  • Self Service BI for Project Managers
  • Predictive Analysis for Data Scientists
The Dashboards Package includes
  • Top 50 Project Watch list
  • KPI by Project Type
  • Project Storyboard
  • Key Task & Milestone
  • Project Status
Ad-Hoc Analysis Reports include
  • Resource Allocation
  • Project Storyboard
Jasper Reports Plugin include
  • Reports can be called from Dashboards

Top 50 Projects Watch list Dashboard

The Top 50 Project Watch list dashboard displays the fifty projects with the highest resource allocation amounts in your organization. The dashboard has gauges and projects listed in a table view, providing visibility into the key performance indicators of status, schedule, alignment, risk, issues and change requests. There are also pie charts that show the distribution of issues, risks, and change requests based on priority. There is a checkbox to see heat map. User can select project row & click the hyperlink to open that project storyboard dashboard for further analysis. Dashboard can be exported to PPT & PDF.

Data Pipeline solutions

KPI by Project Type Dashboard

The KPIs by Project Type dashboard displays the key performance indicators of status, schedule, alignment, and risk as gauges, with column charts of these key indicators by project type. Resource allocation and actual hours are summarized by project type and displayed in pie charts. There is also an issue, risk, and change request bar chart that displays the number of each by project type and priority. User can also further drill down to jasper report from the dashboard. Dashboard can be exported to PPT & PDF.

Data Pipeline solutions
BDB Real time & batch Orchestration

The Project Storyboard Dashboard

The Project Storyboard dashboard shows key aspects of a project organized in separate frames. Each frame in the dashboard displays project information such as project dates, project objective, the amount and cost of resources planned and actual, key accomplishments, upcoming activities, current issues and risks, and the project progress towards goals. This dashboard can be used to analyze the project earned value and track work performance to account for cost and schedule variances.

Data Pipeline solutions

Key Tasks & Milestone status Dashboard

The key Tasks & Milestone status dashboards Shows pie chart for start date schedule & finish date schedule. The dashboard has Work breakdown structure listed in the table view, providing visibility into the key performance indicator of WBS type, status, %complete, Baseline, start date, start days late, schedule %, Finish date, finish days late, Schedule %. Dashboard can be exported into PDF and PPT.

Data Pipeline solutions

Business Story - Self Service BI - Ad Hoc Analysis (Resource Manager)

Resource allocation details are available. Calculates Output in a Flash. Multiple Filters help deeper analysis. IT can show Big Picture to Project Managers. Create Visualization by Drag and Drop. No need of IT support, PMs are in control of their own data. Create your own charts on top of Business Story shared by IT to make it My Story. View Predictive Analysis in various charts. See the charts as Is in Mobile App as well.

Data Pipeline solutions

Predictive Analytics can be used by Data Science team which can give following

Generic Algorithm
Scheduling & Optimization
Objective Function
Project Management

Key Benefits of BDB

Data Insights
Time to Address

Packaged solution can be implemented in 2 weeks

Data Insights
Price

Much lesser as compared to other similar products

Data Insights
Addresses specific needs

BDB dashboard designer has components specifically built keeping CA PPM Market in mind

Data Insights
Expandability

BDB has data connectors to connect with databases & to cater Analytics needs for other Verticals.

Connect with a BDB Expert

Connect Now